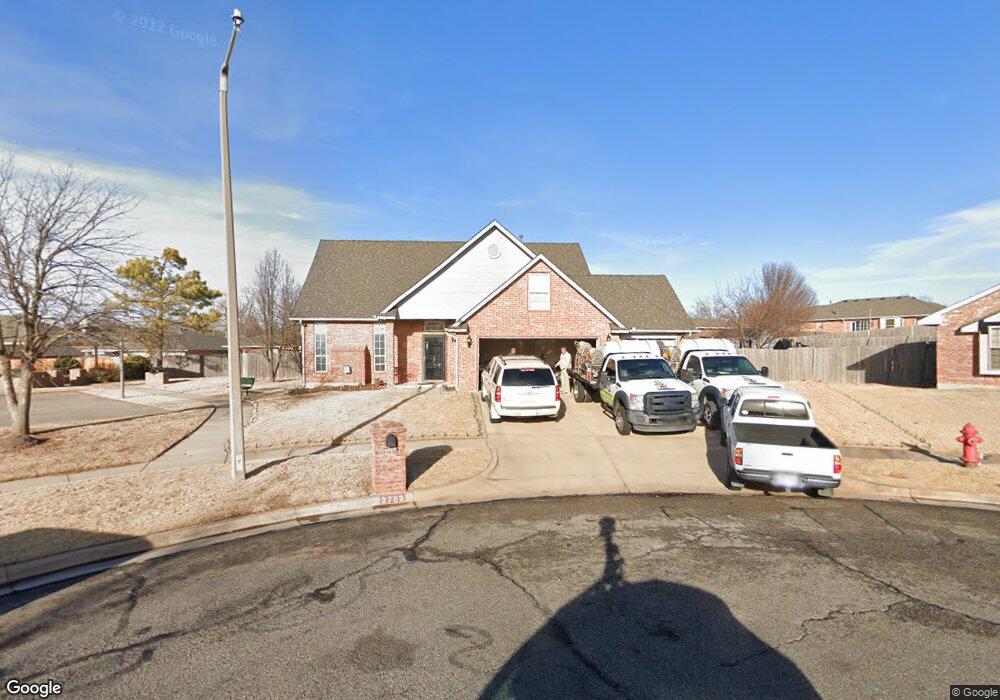
2709 Deer Chase Cir Norman, OK 73071
Northeast Norman NeighborhoodEstimated Value: $312,000 - $355,000
3
Beds
4
Baths
2,364
Sq Ft
$142/Sq Ft
Est. Value
About This Home
This home is located at 2709 Deer Chase Cir, Norman, OK 73071 and is currently estimated at $335,368, approximately $141 per square foot. 2709 Deer Chase Cir is a home located in Cleveland County with nearby schools including Eisenhower Elementary School, Longfellow Middle School, and Norman North High School.
Ownership History
Date
Name
Owned For
Owner Type
Purchase Details
Closed on
Oct 11, 2019
Sold by
Vinyard Christal Sue and Vinyard Phillip David
Bought by
Hatfield Brian D and Johnson Christy Dawn
Current Estimated Value
Home Financials for this Owner
Home Financials are based on the most recent Mortgage that was taken out on this home.
Original Mortgage
$191,250
Outstanding Balance
$167,545
Interest Rate
3.5%
Mortgage Type
New Conventional
Estimated Equity
$167,823
Purchase Details
Closed on
Jun 26, 2017
Sold by
M & E Properties Llc
Bought by
Vinyard Christal Sue and Vinyard Phillip David
Home Financials for this Owner
Home Financials are based on the most recent Mortgage that was taken out on this home.
Original Mortgage
$183,150
Interest Rate
4.02%
Mortgage Type
FHA
Purchase Details
Closed on
Aug 20, 2004
Sold by
Farzaneh Properties, Inc
Bought by
M & E Properties, Llc
Create a Home Valuation Report for This Property
The Home Valuation Report is an in-depth analysis detailing your home's value as well as a comparison with similar homes in the area
Home Values in the Area
Average Home Value in this Area
Purchase History
| Date | Buyer | Sale Price | Title Company |
|---|---|---|---|
| Hatfield Brian D | $225,000 | Cleveland Cnty Abstract & Tt | |
| Vinyard Christal Sue | $205,000 | None Available | |
| M & E Properties, Llc | $190,000 | -- |
Source: Public Records
Mortgage History
| Date | Status | Borrower | Loan Amount |
|---|---|---|---|
| Open | Hatfield Brian D | $191,250 | |
| Previous Owner | Vinyard Christal Sue | $183,150 |
Source: Public Records
Tax History Compared to Growth
Tax History
| Year | Tax Paid | Tax Assessment Tax Assessment Total Assessment is a certain percentage of the fair market value that is determined by local assessors to be the total taxable value of land and additions on the property. | Land | Improvement |
|---|---|---|---|---|
| 2024 | $3,338 | $28,875 | $3,689 | $25,186 |
| 2023 | $3,247 | $28,034 | $4,038 | $23,996 |
| 2022 | $3,019 | $27,217 | $3,799 | $23,418 |
| 2021 | $3,088 | $26,425 | $3,571 | $22,854 |
| 2020 | $2,929 | $25,655 | $3,600 | $22,055 |
| 2019 | $3,010 | $24,919 | $3,578 | $21,341 |
| 2018 | $2,782 | $23,733 | $2,640 | $21,093 |
| 2017 | $2,593 | $25,945 | $0 | $0 |
| 2016 | $0 | $20,845 | $2,640 | $18,205 |
| 2015 | -- | $20,721 | $2,640 | $18,081 |
| 2014 | -- | $20,721 | $2,640 | $18,081 |
Source: Public Records
Map
Nearby Homes
- 1411 Princeton Cir
- 2500 Queenston Ave
- 1517 Pinewood Dr
- 1402 Kingston Rd
- 2704 Quanah Parker Trail
- 3005 Grant Rd
- 2529 Caribou Ct
- 1044 Shadowlake Rd
- 1428 Baycharter St
- 904 Hunting Horse Trail
- 2961 Twin Acres Dr
- 3100 Santa Rosa Ct
- 2712 9th Ave NE
- 1525 Central Pkwy
- 1604 Central Pkwy
- 2904 Leaning Elm Dr
- 1805 Delancey Dr
- 2017 Providence Dr
- 2120 Turtle Creek Dr
- 515 Cripple Creek Dr
- 2709 Deer Chase Cir
- 2705 Deer Chase Cir
- 2708 Deer Chase Cir
- 1408 Northern Hills Rd
- 1404 Northern Hills Rd
- 1412 Northern Hills Rd
- 1400 Northern Hills Rd
- 2701 Deer Chase Cir
- 1316 Northern Hills Rd
- 2716 Northern Hills Rd
- 2704 Deer Chase Cir
- 2708 Northern Hills Rd
- 1312 Northern Hills Rd
- 2700 Deer Chase Cir
- 2617 Deer Chase Dr
- 2704 Northern Hills Rd
- 2700 Northern Hills Rd
- 1308 Northern Hills Rd
- 1305 Deer Run Dr
- 2613 Deer Chase Dr