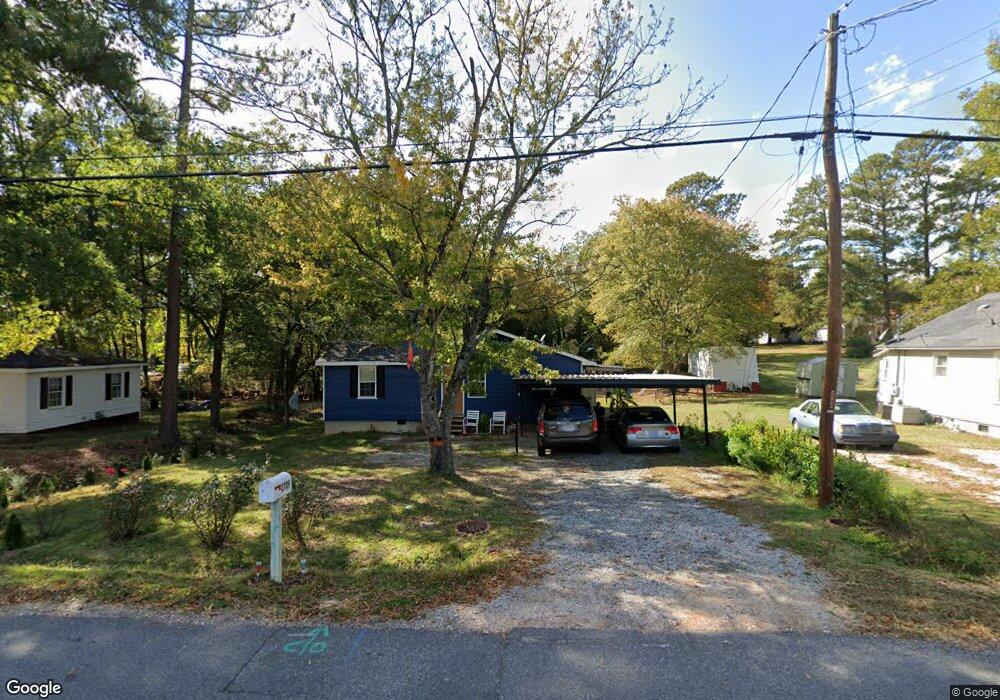
2709 Glendale Ave Kannapolis, NC 28081
Estimated Value: $205,000 - $239,000
3
Beds
1
Bath
960
Sq Ft
$232/Sq Ft
Est. Value
About This Home
This home is located at 2709 Glendale Ave, Kannapolis, NC 28081 and is currently estimated at $222,439, approximately $231 per square foot. 2709 Glendale Ave is a home located in Rowan County with nearby schools including Landis Elementary School, Corriher Lipe Middle School, and South Rowan High School.
Ownership History
Date
Name
Owned For
Owner Type
Purchase Details
Closed on
Oct 17, 2014
Sold by
Fannie Mae
Bought by
Rivas Velazquez Crescencio and Solis Valenicia Yolanda
Current Estimated Value
Purchase Details
Closed on
Jun 11, 2014
Sold by
Provost Gary Joseph and Provost Jennifer L
Bought by
Federal National Mortgage Association and Fannie Mae
Purchase Details
Closed on
Sep 28, 2006
Sold by
Wright Stephen Nicholas
Bought by
Provost Gary J and Provost Jennifer L
Home Financials for this Owner
Home Financials are based on the most recent Mortgage that was taken out on this home.
Original Mortgage
$54,400
Interest Rate
6.48%
Mortgage Type
Construction
Purchase Details
Closed on
Jun 28, 2006
Sold by
Wright Stephen Nicholas
Bought by
Franklin Dana L
Create a Home Valuation Report for This Property
The Home Valuation Report is an in-depth analysis detailing your home's value as well as a comparison with similar homes in the area
Home Values in the Area
Average Home Value in this Area
Purchase History
| Date | Buyer | Sale Price | Title Company |
|---|---|---|---|
| Rivas Velazquez Crescencio | -- | None Available | |
| Federal National Mortgage Association | $61,576 | None Available | |
| Provost Gary J | $35,000 | None Available | |
| Franklin Dana L | -- | None Available |
Source: Public Records
Mortgage History
| Date | Status | Borrower | Loan Amount |
|---|---|---|---|
| Previous Owner | Provost Gary J | $54,400 |
Source: Public Records
Tax History Compared to Growth
Tax History
| Year | Tax Paid | Tax Assessment Tax Assessment Total Assessment is a certain percentage of the fair market value that is determined by local assessors to be the total taxable value of land and additions on the property. | Land | Improvement |
|---|---|---|---|---|
| 2025 | $1,666 | $137,665 | $23,868 | $113,797 |
| 2024 | $1,666 | $137,665 | $23,868 | $113,797 |
| 2023 | $1,666 | $137,665 | $23,868 | $113,797 |
| 2022 | $935 | $72,646 | $18,360 | $54,286 |
| 2021 | $935 | $72,646 | $18,360 | $54,286 |
| 2020 | $935 | $72,646 | $18,360 | $54,286 |
| 2019 | $827 | $64,234 | $18,360 | $45,874 |
| 2018 | $742 | $58,253 | $18,360 | $39,893 |
| 2017 | $742 | $58,253 | $18,360 | $39,893 |
| 2016 | $742 | $58,253 | $18,360 | $39,893 |
| 2015 | $753 | $58,253 | $18,360 | $39,893 |
| 2014 | $725 | $58,018 | $16,156 | $41,862 |
Source: Public Records
Map
Nearby Homes
- 2885 Vale Ave
- 2909 Glendale Ave
- 515 Rosemont Ave
- 2401 Brookview Ave
- 0 Vale Ave
- 0 Summit Ave
- 203 E 22nd St
- 2003 Plaza Ave
- 859 Irish Creek Dr
- 107 W 21st St
- 843 Fairway Dr Unit 44
- 2274 Tullymore Dr Unit 14
- 513 Sand Dunes Dr
- 531 Sand Dunes Dr
- 519 Sand Dunes Dr
- 391 Copes Ct
- 201 W 19th St
- 2319 Tullymore Dr Unit 39
- 204 E 27th St
- 239 W 18th St
- 2703 Glendale Ave
- 404 Belva St
- 2713 Glendale Ave
- 2701 Glendale Ave
- 2701 Glendale Ave Unit Partial 72 & All 73
- 406 Belva St
- 403 Rosemont Ave
- 323 Rice St
- 401 Rosemont Ave
- 318 Rice St
- 405 Rosemont Ave
- 408 Belva St
- 335 Rosemont Ave
- 321 Rice St
- 403 Belva St
- 316 Rice St
- 2704 Vale Ave
- 319 Rice St
- 331 Rosemont Ave
- 410 Belva St