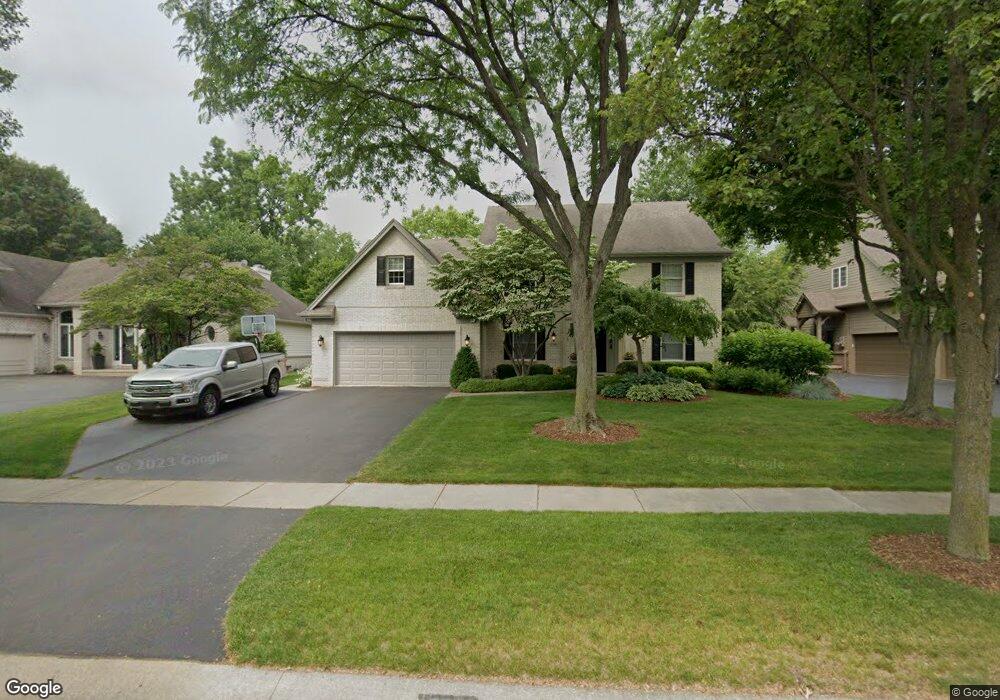
2709 Gray Fox Curve Toledo, OH 43617
Estimated Value: $417,060 - $525,000
4
Beds
3
Baths
3,211
Sq Ft
$150/Sq Ft
Est. Value
About This Home
This home is located at 2709 Gray Fox Curve, Toledo, OH 43617 and is currently estimated at $482,515, approximately $150 per square foot. 2709 Gray Fox Curve is a home located in Lucas County with nearby schools including Central Trail Elementary School, Sylvania Timberstone Junior High School, and Sylvania Southview High School.
Ownership History
Date
Name
Owned For
Owner Type
Purchase Details
Closed on
Jul 15, 2015
Sold by
Vlasnik Robert J and Vlasnik Debra S
Bought by
Vlasnik Robert J and Joint Debra S Vlasnik
Current Estimated Value
Purchase Details
Closed on
Apr 17, 1999
Sold by
Kubala Ronald W and Kubala Mikiko M
Bought by
Vlasnik Robert J and Vlasnik Debra S
Home Financials for this Owner
Home Financials are based on the most recent Mortgage that was taken out on this home.
Original Mortgage
$198,000
Interest Rate
6.94%
Purchase Details
Closed on
Mar 19, 1996
Sold by
Rogers Williams D
Bought by
Kubala Ronald W and Kubala Mikiko M
Home Financials for this Owner
Home Financials are based on the most recent Mortgage that was taken out on this home.
Original Mortgage
$185,000
Interest Rate
7.06%
Mortgage Type
New Conventional
Purchase Details
Closed on
Jun 7, 1994
Sold by
Louisville Title Trst
Bought by
Rogers William D
Create a Home Valuation Report for This Property
The Home Valuation Report is an in-depth analysis detailing your home's value as well as a comparison with similar homes in the area
Home Values in the Area
Average Home Value in this Area
Purchase History
We collect this data history from publicly available records. To have your information removed, we recommend requesting removal directly through your county’s website.
| Date | Buyer | Sale Price | Title Company |
|---|---|---|---|
| Vlasnik Robert J | -- | None Available | |
| Vlasnik Robert J | $314,000 | -- | |
| Kubala Ronald W | $270,000 | -- | |
| Rogers William D | $47,100 | -- |
Source: Public Records
Mortgage History
We collect this data history from publicly available records. To have your information removed, we recommend requesting removal directly through your county’s website.
| Date | Status | Borrower | Loan Amount |
|---|---|---|---|
| Previous Owner | Vlasnik Robert J | $198,000 | |
| Previous Owner | Kubala Ronald W | $185,000 |
Source: Public Records
Tax History
| Year | Tax Paid | Tax Assessment Tax Assessment Total Assessment is a certain percentage of the fair market value that is determined by local assessors to be the total taxable value of land and additions on the property. | Land | Improvement |
|---|---|---|---|---|
| 2025 | -- | $133,805 | $16,275 | $117,530 |
| 2024 | $4,328 | $133,805 | $16,275 | $117,530 |
| 2023 | $7,131 | $94,360 | $13,615 | $80,745 |
| 2022 | $7,127 | $94,360 | $13,615 | $80,745 |
| 2021 | $7,296 | $94,360 | $13,615 | $80,745 |
| 2020 | $7,987 | $91,595 | $13,195 | $78,400 |
| 2019 | $7,695 | $91,595 | $13,195 | $78,400 |
| 2018 | $7,575 | $91,595 | $13,195 | $78,400 |
| 2017 | $8,072 | $87,570 | $11,025 | $76,545 |
| 2016 | $7,919 | $250,200 | $31,500 | $218,700 |
| 2015 | $7,469 | $250,200 | $31,500 | $218,700 |
| 2014 | $7,083 | $84,220 | $10,610 | $73,610 |
| 2013 | $7,083 | $84,220 | $10,610 | $73,610 |
Source: Public Records
Map
Nearby Homes
- 7028 Shooters Hill Rd
- 7047 White Tail Ct
- 2805 Spring Water Dr
- 6911 Milrose Ln
- 2910 Tracewood Dr
- 2840 N Mccord Rd
- 6957 Cloister Rd
- 2338 Parliament Square
- 3251 Woodbrook Rd Unit 3251
- 2300 Whispering Pines Dr
- 7546 Hollow Creek Dr
- 6804 Woodmeadow Dr Unit 6804
- 2110 Austin Bluffs Ct
- 6825 Kelker St
- 7543 Castle Ridge Rd
- 2814 Wilford Dr
- 6742 Ridgewood Trail
- 6409 Triple Crown Ln
- 6730 Ridgewood Trail
- 6405 Triple Crown Ln
- 7043 Mourning Dove Ct
- 2623 Gray Fox Curve
- 2640 Gray Fox Curve
- 7027 Mourning Dove Ct
- 2632 Gray Fox Curve
- 2701 Gray Fox Curve
- 7044 Mourning Dove Ct
- 2671 Gray Fox Curve
- 2717 Gray Fox Curve
- 7036 Mourning Dove Ct
- 2624 Gray Fox Curve
- 7019 Mourning Dove Ct
- 7028 Mourning Dove Ct
- 2725 Gray Fox Curve
- 2663 Gray Fox Curve
- 2708 Rexton Ridge Cir
- 2616 Gray Fox Curve
- 2716 Rexton Ridge Cir
- 2733 Gray Fox Curve
- 7043 Altonborough
Your Personal Tour Guide
Ask me questions while you tour the home.