2709 Kulshan St Bellingham, WA 98225
Columbia NeighborhoodEstimated Value: $670,720 - $739,000
2
Beds
2
Baths
1,180
Sq Ft
$592/Sq Ft
Est. Value
About This Home
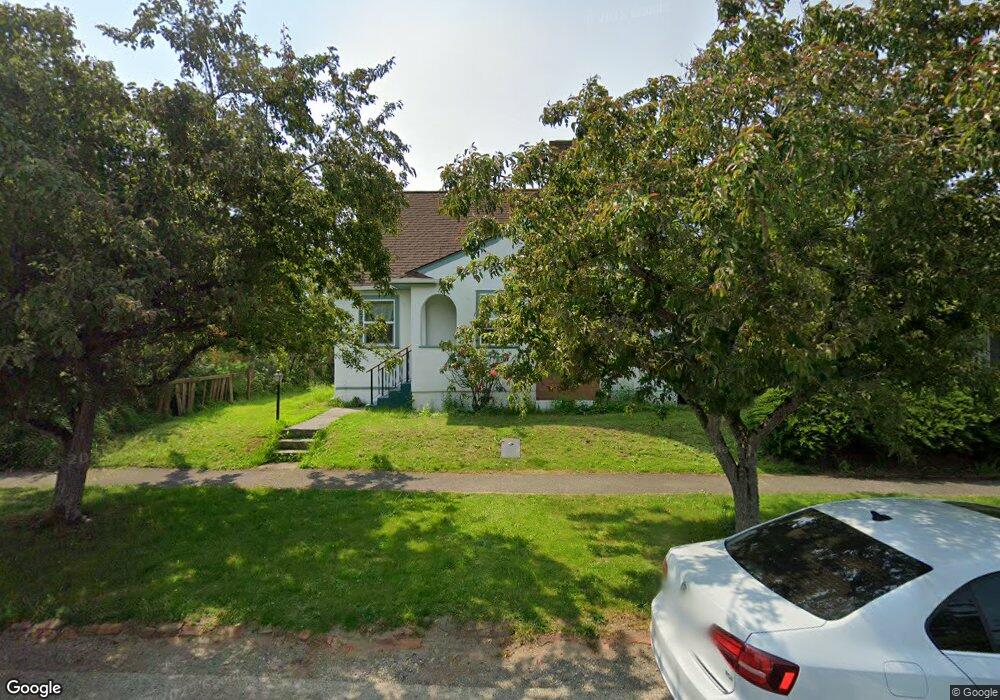
This home is located at 2709 Kulshan St, Bellingham, WA 98225 and is currently estimated at $698,180, approximately $591 per square foot. 2709 Kulshan St is a home located in Whatcom County with nearby schools including Parkview Elementary School, Whatcom Middle School, and Bellingham High School.
Ownership History
Date
Name
Owned For
Owner Type
Purchase Details
Closed on
Dec 9, 2019
Sold by
Moore Susan M and Estate Of Michael Earl Westby
Bought by
Moore Aaron J
Current Estimated Value
Purchase Details
Closed on
Sep 7, 2011
Sold by
Westby Michael E
Bought by
Westby Michael E
Create a Home Valuation Report for This Property
The Home Valuation Report is an in-depth analysis detailing your home's value as well as a comparison with similar homes in the area
Home Values in the Area
Average Home Value in this Area
Purchase History
| Date | Buyer | Sale Price | Title Company |
|---|---|---|---|
| Moore Aaron J | -- | None Available | |
| Westby Michael E | $209,291 | None Available |
Source: Public Records
Tax History Compared to Growth
Tax History
| Year | Tax Paid | Tax Assessment Tax Assessment Total Assessment is a certain percentage of the fair market value that is determined by local assessors to be the total taxable value of land and additions on the property. | Land | Improvement |
|---|---|---|---|---|
| 2024 | $4,960 | $621,573 | $246,304 | $375,269 |
| 2023 | $4,960 | $637,360 | $252,560 | $384,800 |
| 2022 | $4,051 | $549,458 | $217,728 | $331,730 |
| 2021 | $3,974 | $436,078 | $172,800 | $263,278 |
| 2020 | $3,838 | $403,776 | $160,000 | $243,776 |
| 2019 | $3,436 | $376,966 | $136,423 | $240,543 |
| 2018 | $3,460 | $338,378 | $122,483 | $215,895 |
| 2017 | $2,985 | $291,333 | $105,452 | $185,881 |
| 2016 | $2,612 | $262,675 | $94,628 | $168,047 |
| 2015 | $2,561 | $239,251 | $86,428 | $152,823 |
| 2014 | -- | $226,993 | $82,000 | $144,993 |
| 2013 | -- | $219,059 | $73,500 | $145,559 |
Source: Public Records
Map
Nearby Homes
- 2600 Elm St
- 2500 Meridian St
- 2805 Walnut St
- 3008 Meridian St
- 3018 Elm St
- 1800 J St
- 1508 E Maplewood Ave
- 1410 J St
- 1315 Astor St
- 2500 Cornwall Ave
- 1200 W Holly St
- 3000 Firwood Ave
- 2019 Cornwall Ave
- 2432 Grant St
- 2111 Franklin St
- 2715 W Maplewood Ave Unit 122
- 3330 Northwest Ave
- 3350 Northwest Ave Unit 1102
- 1025 Granary Ave Unit 503
- 1025 Granary Ave Unit 404