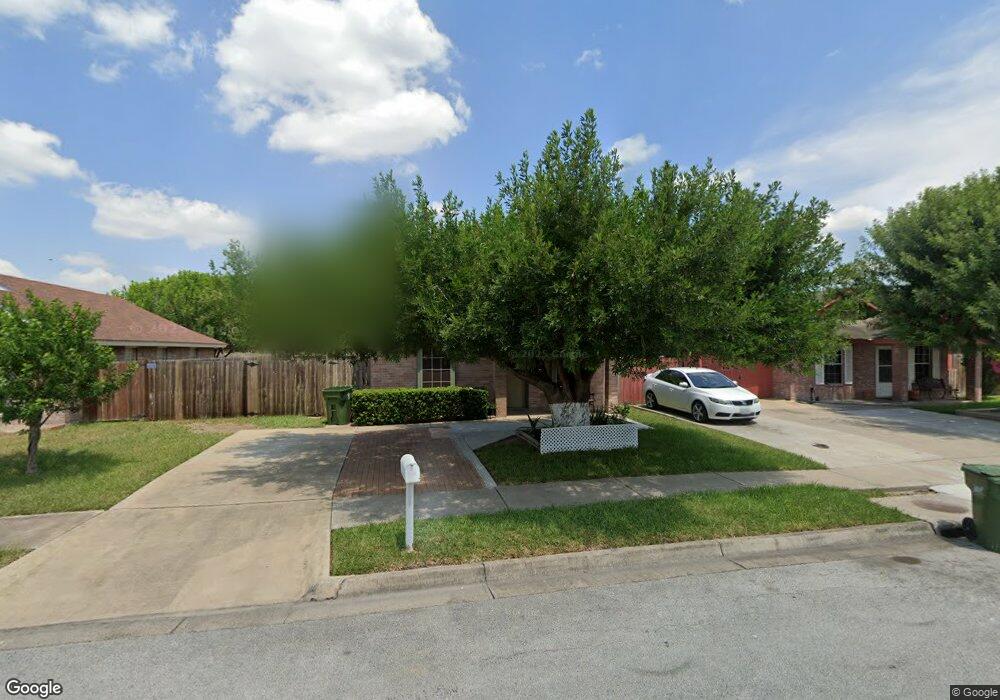
2709 Marbella St Brownsville, TX 78520
Estimated Value: $150,238 - $174,000
--
Bed
--
Bath
925
Sq Ft
$175/Sq Ft
Est. Value
About This Home
This home is located at 2709 Marbella St, Brownsville, TX 78520 and is currently estimated at $162,310, approximately $175 per square foot. 2709 Marbella St is a home located in Cameron County with nearby schools including Yturria Elementary School, Stillman Middle School, and Veterans Memorial Early College High School.
Ownership History
Date
Name
Owned For
Owner Type
Purchase Details
Closed on
Jan 24, 2022
Sold by
Emeterio Davila
Bought by
Armendariz Socorro
Current Estimated Value
Purchase Details
Closed on
Aug 29, 2016
Sold by
Davila Emeerio
Bought by
Juarez Socorro Armendariz
Purchase Details
Closed on
Nov 9, 2005
Sold by
El Valle Properties Ltd
Bought by
Davila Emeterio and Armendariz Socorro
Home Financials for this Owner
Home Financials are based on the most recent Mortgage that was taken out on this home.
Original Mortgage
$55,500
Interest Rate
5.92%
Purchase Details
Closed on
May 6, 2005
Sold by
Chapa Jaime and Chapa Maria Lourdes
Bought by
El Valle Properties Ltd
Purchase Details
Closed on
Feb 15, 2002
Sold by
El Valle Properties Ltd
Bought by
Chapa Jaime and Chapa Maria Lourdes
Home Financials for this Owner
Home Financials are based on the most recent Mortgage that was taken out on this home.
Original Mortgage
$49,000
Interest Rate
6.77%
Create a Home Valuation Report for This Property
The Home Valuation Report is an in-depth analysis detailing your home's value as well as a comparison with similar homes in the area
Home Values in the Area
Average Home Value in this Area
Purchase History
| Date | Buyer | Sale Price | Title Company |
|---|---|---|---|
| Armendariz Socorro | -- | Sanchez & Sanchez | |
| Juarez Socorro Armendariz | -- | None Available | |
| Davila Emeterio | -- | -- | |
| El Valle Properties Ltd | $50,822 | -- | |
| Chapa Jaime | -- | -- |
Source: Public Records
Mortgage History
| Date | Status | Borrower | Loan Amount |
|---|---|---|---|
| Previous Owner | Davila Emeterio | $55,500 | |
| Previous Owner | Chapa Jaime | $49,000 |
Source: Public Records
Tax History Compared to Growth
Tax History
| Year | Tax Paid | Tax Assessment Tax Assessment Total Assessment is a certain percentage of the fair market value that is determined by local assessors to be the total taxable value of land and additions on the property. | Land | Improvement |
|---|---|---|---|---|
| 2025 | $1,835 | $135,267 | $44,049 | $91,218 |
| 2024 | $1,835 | $136,372 | $44,049 | $92,323 |
| 2023 | $2,896 | $126,209 | $32,781 | $93,428 |
| 2022 | $2,254 | $86,898 | $0 | $0 |
| 2021 | $2,042 | $88,492 | $24,000 | $64,492 |
| 2020 | $1,871 | $71,816 | $24,000 | $47,816 |
| 2019 | $1,794 | $72,895 | $24,000 | $48,895 |
| 2018 | $1,625 | $65,445 | $21,000 | $44,445 |
| 2017 | $1,409 | $55,606 | $21,000 | $34,606 |
| 2016 | $1,330 | $52,480 | $17,500 | $34,980 |
| 2015 | $1,103 | $51,530 | $17,000 | $34,530 |
Source: Public Records
Map
Nearby Homes
- 2720 Mayorca St
- 1920 Royal Oak St
- 2822 W Alton Gloor Blvd
- 2848 Riviera St
- 1974 Royal Oak St
- 1708 Deep Spring St
- 1809 Royal Oak St
- 0 W Alton Gloor Blvd
- 2400 Firenze St
- 3516 Hidalgo Cir Unit LOT 1 BLK 4
- 3604 Hidalgo Cir Unit LOT 1 BLK 6
- 2782 Normandy St
- 4045 Lake View Dr
- 2650 Paris St
- 3515 Heritage Cir Unit LOT 10 & 11
- 2614 Paris St
- TBD Beach Dunes Lot 21
- 2734 Paris St
- 3770 Altamira
- 2500 Windsor Place
- 2705 Marbella St
- 2713 Marbella St
- 0 Marbella St Unit 29720092
- 2717 Marbella St Unit 20
- 2701 Marbella St
- 2720 Capri St
- 2712 Capri St
- 2724 Capri St
- 2716 Capri St
- 2721 Marbella St
- 2710 Marbella St
- 2706 Marbella St
- 2714 Marbella St
- 2728 Capri St
- 2708 Capri St
- 2718 Marbella St
- 2725 Marbella St
- 2732 Capri St
- 2722 Marbella St
- 2745 Madrid Ave