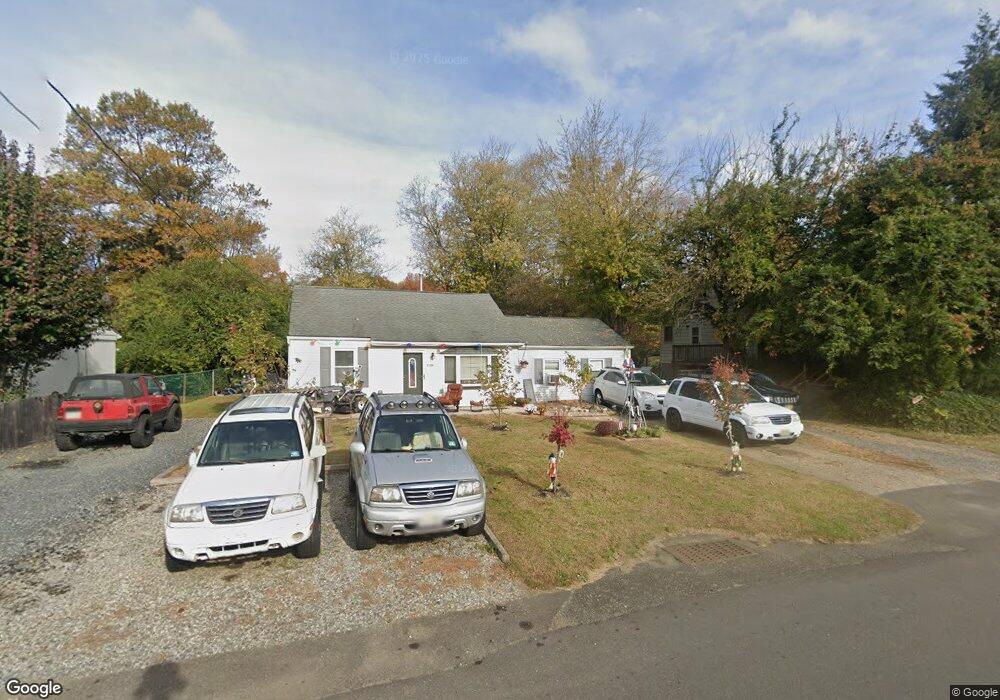
2709 Monmouth Rd Jobstown, NJ 08041
Estimated Value: $262,642 - $506,000
3
Beds
1
Bath
1,320
Sq Ft
$256/Sq Ft
Est. Value
About This Home
This home is located at 2709 Monmouth Rd, Jobstown, NJ 08041 and is currently estimated at $337,411, approximately $255 per square foot. 2709 Monmouth Rd is a home located in Burlington County with nearby schools including Springfield Township Elementary School, Northern Burlington County Regional Middle School, and Northern Burlington County Regional High School.
Ownership History
Date
Name
Owned For
Owner Type
Purchase Details
Closed on
Oct 30, 2019
Sold by
Investors Bank
Bought by
Serrano Edwin N
Current Estimated Value
Home Financials for this Owner
Home Financials are based on the most recent Mortgage that was taken out on this home.
Original Mortgage
$129,980
Outstanding Balance
$114,463
Interest Rate
3.65%
Mortgage Type
New Conventional
Estimated Equity
$222,948
Purchase Details
Closed on
Apr 22, 2019
Sold by
Rice Timothy
Bought by
Invetsors Bank
Purchase Details
Closed on
Mar 17, 2005
Sold by
Reed Lori Ann
Bought by
Rice Timothy
Home Financials for this Owner
Home Financials are based on the most recent Mortgage that was taken out on this home.
Original Mortgage
$120,000
Interest Rate
5.61%
Mortgage Type
Stand Alone First
Purchase Details
Closed on
Mar 5, 2003
Sold by
Shook Leona
Bought by
Reed Lori Ann
Create a Home Valuation Report for This Property
The Home Valuation Report is an in-depth analysis detailing your home's value as well as a comparison with similar homes in the area
Home Values in the Area
Average Home Value in this Area
Purchase History
| Date | Buyer | Sale Price | Title Company |
|---|---|---|---|
| Serrano Edwin N | $134,000 | Title Evolution Llc | |
| Invetsors Bank | -- | None Available | |
| Rice Timothy | $102,495 | Eland Title Solutions | |
| -- | $102,500 | -- | |
| Reed Lori Ann | -- | -- |
Source: Public Records
Mortgage History
| Date | Status | Borrower | Loan Amount |
|---|---|---|---|
| Open | Serrano Edwin N | $129,980 | |
| Previous Owner | -- | $120,000 |
Source: Public Records
Tax History Compared to Growth
Tax History
| Year | Tax Paid | Tax Assessment Tax Assessment Total Assessment is a certain percentage of the fair market value that is determined by local assessors to be the total taxable value of land and additions on the property. | Land | Improvement |
|---|---|---|---|---|
| 2025 | $3,455 | $109,000 | $49,400 | $59,600 |
| 2024 | $3,363 | $109,000 | $49,400 | $59,600 |
| 2023 | $3,363 | $109,000 | $49,400 | $59,600 |
| 2022 | $3,241 | $109,000 | $49,400 | $59,600 |
| 2021 | $3,260 | $109,000 | $49,400 | $59,600 |
| 2020 | $3,251 | $109,000 | $49,400 | $59,600 |
| 2019 | $3,249 | $109,000 | $49,400 | $59,600 |
| 2018 | $3,247 | $109,000 | $49,400 | $59,600 |
| 2017 | $3,235 | $109,000 | $49,400 | $59,600 |
| 2016 | $3,220 | $109,000 | $49,400 | $59,600 |
| 2015 | $3,102 | $109,000 | $49,400 | $59,600 |
| 2014 | $2,928 | $109,000 | $49,400 | $59,600 |
Source: Public Records
Map
Nearby Homes
- 211 Georgetown Wrightstown Rd
- 27058 Mount Pleasant Rd
- 36 Chesterfield Rd
- 713 Monmouth Rd
- 87 Chamber Ln
- 701 Monmouth Rd
- 49 Chamber Ln
- 250 Warren Dr
- 1 Barclay Ct
- 25 Ellington Dr
- 512 Wrightstown Sykesville Rd
- 511 25 Wrightstown Sykesville Rd Unit 25
- 43 Barbary Ln
- 45 W Main St
- 3 Jasper Dr
- 5 Pheasant Ct
- 511 Wrightstown Sykesville Rd Unit 147
- 2770 Monmouth Rd
- 51 Lincoln Dr
- 36 White Pine Rd
- 2711 Monmouth Rd
- 2707 Monmouth Rd Unit B
- 2707 Monmouth Rd
- 2713 Monmouth Rd
- 2715 Monmouth Rd
- 2717 Monmouth Rd
- 2719 Monmouth Rd
- 2721 Monmouth Rd
- 7 Applegate Rd
- 2723 Monmouth Rd
- 2725 Monmouth Rd
- 2727 Monmouth Rd
- 11 Applegate Rd
- 2729 Monmouth Rd
- 2731 Monmouth Rd
- 2733 Monmouth Rd
- 9 Applegate Rd
- 2734 Monmouth Rd
- 6 Applegate Rd
- 10 Applegate Rd