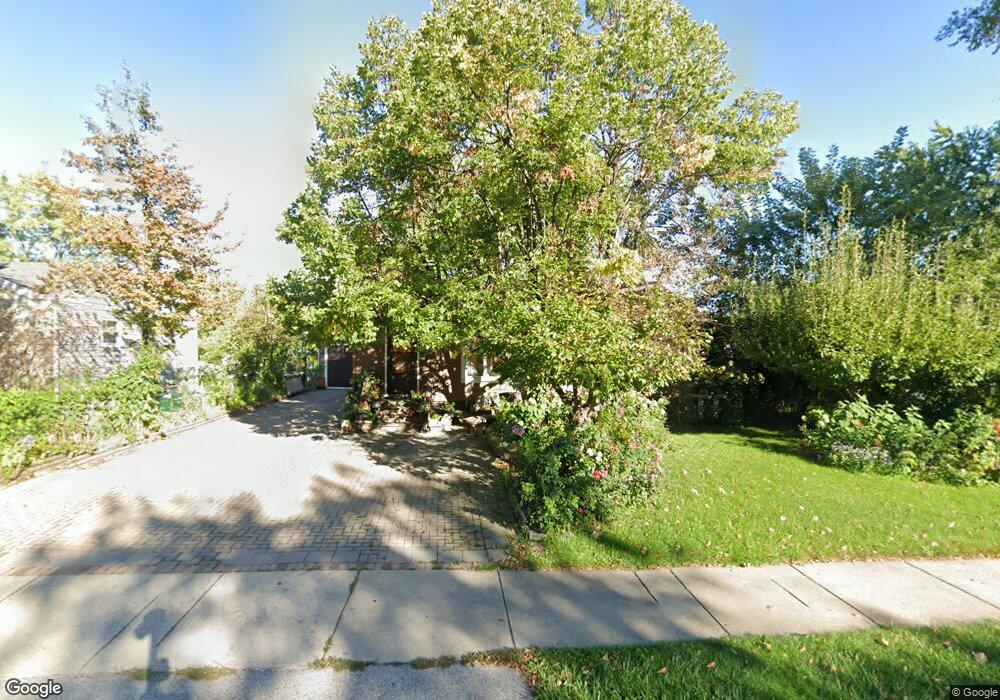
2709 N Lewis Ave Waukegan, IL 60087
Lake County Gardens NeighborhoodEstimated Value: $213,000 - $245,000
3
Beds
1
Bath
1,044
Sq Ft
$219/Sq Ft
Est. Value
About This Home
This home is located at 2709 N Lewis Ave, Waukegan, IL 60087 and is currently estimated at $228,480, approximately $218 per square foot. 2709 N Lewis Ave is a home located in Lake County with nearby schools including Little Fort Elementary School, Jack Benny Middle School, and Waukegan High School.
Ownership History
Date
Name
Owned For
Owner Type
Purchase Details
Closed on
Nov 12, 2020
Sold by
Pizano Baltazar S and Pizano Maria G
Bought by
Pizano Baltazar S and Pizano Maria G
Current Estimated Value
Purchase Details
Closed on
Jan 29, 1999
Sold by
Pizano Baltazar S and Pizano Naria G
Bought by
Pizano Baltazar S and Pizano Maria G
Home Financials for this Owner
Home Financials are based on the most recent Mortgage that was taken out on this home.
Original Mortgage
$101,898
Interest Rate
6.88%
Mortgage Type
FHA
Purchase Details
Closed on
Jan 16, 1997
Sold by
Colcol Wilfredo D and Colcol Florecita M
Bought by
Pizano Baltazar S and Pizano Maria G
Home Financials for this Owner
Home Financials are based on the most recent Mortgage that was taken out on this home.
Original Mortgage
$97,290
Interest Rate
7.54%
Mortgage Type
FHA
Create a Home Valuation Report for This Property
The Home Valuation Report is an in-depth analysis detailing your home's value as well as a comparison with similar homes in the area
Home Values in the Area
Average Home Value in this Area
Purchase History
| Date | Buyer | Sale Price | Title Company |
|---|---|---|---|
| Pizano Baltazar S | -- | Attorney | |
| Pizano Baltazar S | -- | -- | |
| Pizano Baltazar S | $98,000 | Ticor Title Insurance |
Source: Public Records
Mortgage History
| Date | Status | Borrower | Loan Amount |
|---|---|---|---|
| Closed | Pizano Baltazar S | $101,898 | |
| Closed | Pizano Baltazar S | $97,290 |
Source: Public Records
Tax History Compared to Growth
Tax History
| Year | Tax Paid | Tax Assessment Tax Assessment Total Assessment is a certain percentage of the fair market value that is determined by local assessors to be the total taxable value of land and additions on the property. | Land | Improvement |
|---|---|---|---|---|
| 2024 | $5,135 | $69,130 | $8,510 | $60,620 |
| 2023 | $4,426 | $62,453 | $7,689 | $54,764 |
| 2022 | $4,426 | $51,271 | $6,960 | $44,311 |
| 2021 | $4,048 | $44,829 | $6,025 | $38,804 |
| 2020 | $4,054 | $41,764 | $5,613 | $36,151 |
| 2019 | $4,027 | $38,270 | $5,143 | $33,127 |
| 2018 | $3,115 | $30,476 | $6,552 | $23,924 |
| 2017 | $2,982 | $26,963 | $5,797 | $21,166 |
| 2016 | $2,693 | $23,429 | $5,037 | $18,392 |
| 2015 | $2,529 | $20,969 | $4,508 | $16,461 |
| 2014 | $2,951 | $22,983 | $4,950 | $18,033 |
| 2012 | $3,878 | $24,899 | $5,362 | $19,537 |
Source: Public Records
Map
Nearby Homes
- 2613 N Lewis Ave
- 1612 Whitney St
- 2350 N Lewis Ave
- 1636 Rice St
- 2625 Vercoe Ave
- 3211 Rugby Ct
- 2708 Dana Ave
- 2705 Dana Ave
- 2232 Walnut St
- 2713 Varonen Ave
- 3101 Country Club Ln
- 12312 W Audrey Ave
- 37966 N Cornell Rd
- 3411 N Lewis Ave
- 2246 Ottawa Rd
- 37905 N Loyola Ave
- 1913 Chippewa Rd
- 301 W Eagle Ct
- 2440 W Cheyenne Rd
- 1905 Linden Ave
- 2713 N Lewis Ave Unit 4
- 2705 N Lewis Ave
- 2708 N Elmwood Ave
- 2712 N Elmwood Ave
- 2704 N Elmwood Ave
- 2717 N Lewis Ave Unit 4
- 2701 N Lewis Ave
- 1800 Ballentine St
- 2716 N Elmwood Ave
- 2721 N Lewis Ave
- 2700 N Elmwood Ave
- 2720 N Elmwood Ave
- 2712 N Lewis Ave
- 2718 N Lewis Ave
- 2725 N Lewis Ave
- 2706 N Lewis Ave
- 2724 N Lewis Ave
- 1741 Boardman St Unit 4
- 2724 N Elmwood Ave
- 2705 N Elmwood Ave Unit 4