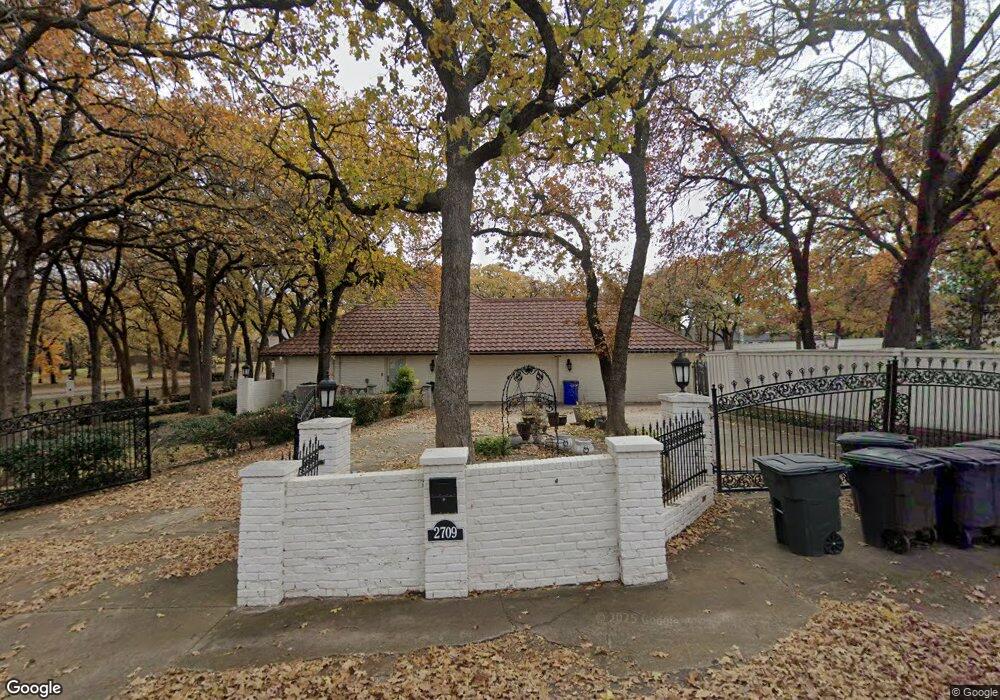
2709 Sherwood Ln Colleyville, TX 76034
Estimated Value: $1,188,000 - $1,987,000
5
Beds
8
Baths
7,406
Sq Ft
$218/Sq Ft
Est. Value
About This Home
This home is located at 2709 Sherwood Ln, Colleyville, TX 76034 and is currently estimated at $1,611,392, approximately $217 per square foot. 2709 Sherwood Ln is a home located in Tarrant County with nearby schools including O.C. Taylor Elementary School, Colleyville Middle School, and Covenant Christian Academy.
Ownership History
Date
Name
Owned For
Owner Type
Purchase Details
Closed on
Sep 1, 2006
Sold by
Guzman Jose and Guzman Monika
Bought by
Crain Kenneth H and Crain Amy B
Current Estimated Value
Home Financials for this Owner
Home Financials are based on the most recent Mortgage that was taken out on this home.
Original Mortgage
$960,000
Outstanding Balance
$578,086
Interest Rate
6.72%
Mortgage Type
Purchase Money Mortgage
Estimated Equity
$1,033,306
Purchase Details
Closed on
Sep 23, 1998
Sold by
Marsicano James D and Marsicano Nancy Raynor
Bought by
Guzman Jose and Guzman Monika
Home Financials for this Owner
Home Financials are based on the most recent Mortgage that was taken out on this home.
Original Mortgage
$332,000
Interest Rate
6.91%
Purchase Details
Closed on
Jul 21, 1998
Sold by
Walker Danny K and Walker Velma
Bought by
Marsicano James D and Marsicano Nancy Raynor
Home Financials for this Owner
Home Financials are based on the most recent Mortgage that was taken out on this home.
Original Mortgage
$312,000
Interest Rate
6.94%
Purchase Details
Closed on
Jan 29, 1998
Sold by
Chateau Capital Investments Inc
Bought by
Walker Velma M
Create a Home Valuation Report for This Property
The Home Valuation Report is an in-depth analysis detailing your home's value as well as a comparison with similar homes in the area
Home Values in the Area
Average Home Value in this Area
Purchase History
| Date | Buyer | Sale Price | Title Company |
|---|---|---|---|
| Crain Kenneth H | -- | American Title | |
| Guzman Jose | -- | American Title Company | |
| Marsicano James D | -- | American Title Co | |
| Walker Velma M | -- | -- |
Source: Public Records
Mortgage History
| Date | Status | Borrower | Loan Amount |
|---|---|---|---|
| Open | Crain Kenneth H | $960,000 | |
| Previous Owner | Guzman Jose | $332,000 | |
| Previous Owner | Marsicano James D | $312,000 |
Source: Public Records
Tax History Compared to Growth
Tax History
| Year | Tax Paid | Tax Assessment Tax Assessment Total Assessment is a certain percentage of the fair market value that is determined by local assessors to be the total taxable value of land and additions on the property. | Land | Improvement |
|---|---|---|---|---|
| 2025 | $4,481 | $1,418,896 | $405,460 | $1,013,436 |
| 2024 | $4,481 | $1,418,896 | $405,460 | $1,013,436 |
| 2023 | $16,876 | $1,009,563 | $405,460 | $604,103 |
| 2022 | $17,963 | $909,496 | $405,460 | $504,036 |
| 2021 | $19,478 | $886,960 | $380,460 | $506,500 |
| 2020 | $19,217 | $864,789 | $380,460 | $484,329 |
| 2019 | $19,972 | $867,252 | $380,460 | $486,792 |
| 2018 | $4,669 | $785,301 | $380,460 | $404,841 |
| 2017 | $21,006 | $889,157 | $380,460 | $508,697 |
| 2016 | $19,667 | $832,499 | $378,960 | $453,539 |
| 2015 | $26,696 | $1,170,408 | $90,000 | $1,080,408 |
| 2014 | $26,696 | $1,152,000 | $90,000 | $1,062,000 |
Source: Public Records
Map
Nearby Homes
- 2904 Hickory Hill Ln
- 2904 Hickory Hill St
- 4309 Meandering Way
- 4300 Eaton Cir
- 3909 Allendale St
- 2201 Oak Knoll Ct
- 3713 Teal Ln
- 3816 Rolling Meadows Dr
- 3900 Jackson Rd
- 3013 Bent Tree Ln
- 2609 Talisman Ct
- Seaberry II Plan at Grace Park - Signature Series
- Primrose FE V Plan at Grace Park - Signature Series
- Hawthorne Plan at Grace Park - Signature Series
- Seaberry Plan at Grace Park - Signature Series
- Gardenia Plan at Grace Park - Signature Series
- Bellflower IV Plan at Grace Park - Signature Series
- Bellflower II Plan at Grace Park - Signature Series
- Carolina IV Plan at Grace Park - Signature Series
- Carolina Plan at Grace Park - Signature Series
- 4208 Allendale St
- 2804 Sherwood Ln
- 2705 Sherwood Ln
- 4205 Allendale St
- 2708 Sherwood Ln
- 2800 Sherwood Ln
- 2808 Sherwood Ln
- 4204 Allendale St
- 2900 Sherwood Ln
- 2905 Sherwood Ln
- 2700 Sherwood Ln
- 4109 Spring Hollow St
- 2908 Hickory Hill Ln
- 4105 Spring Hollow St
- 2909 Sherwood Ln
- 2908 Sherwood Ln
- 2901 Hickory Hill Ln
- 2604 Sherwood Ln
- 4104 Allendale St
- 2905 Hickory Hill Ln