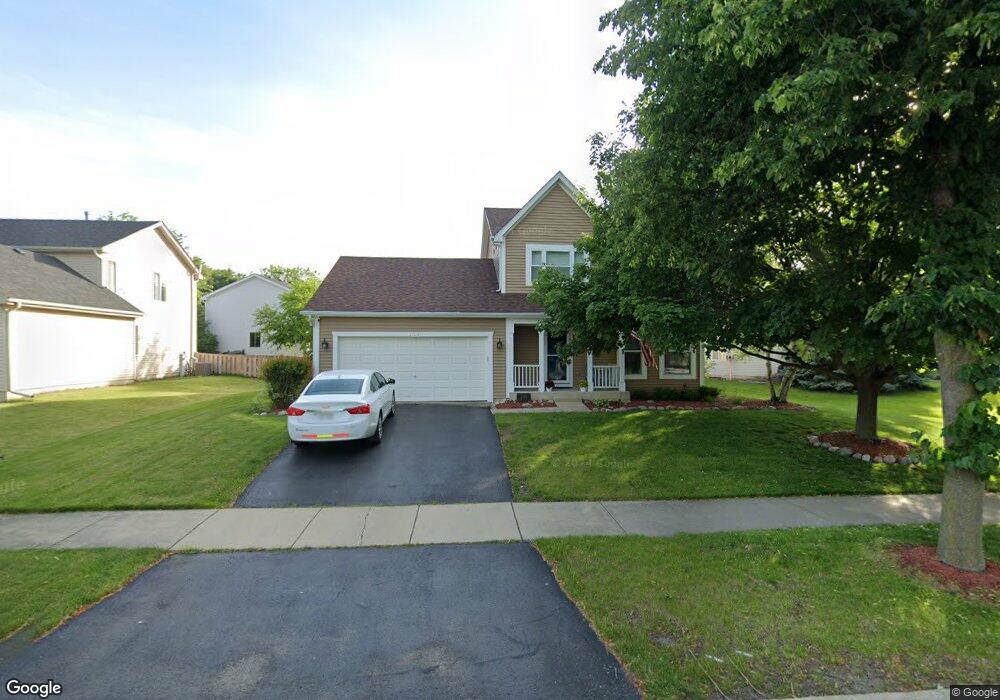
2709 Stuart Kaplan Dr Aurora, IL 60503
Far Southeast NeighborhoodEstimated Value: $359,592 - $428,000
3
Beds
3
Baths
1,626
Sq Ft
$248/Sq Ft
Est. Value
About This Home
This home is located at 2709 Stuart Kaplan Dr, Aurora, IL 60503 and is currently estimated at $402,648, approximately $247 per square foot. 2709 Stuart Kaplan Dr is a home located in Will County with nearby schools including Wolfs Crossing Elementary School, Bednarcik Jr. High School, and Oswego East High School.
Ownership History
Date
Name
Owned For
Owner Type
Purchase Details
Closed on
Dec 15, 2006
Sold by
Fitch Michael and Fitch Christina
Bought by
Zegadlo Michael J and Zegadlo Holly
Current Estimated Value
Home Financials for this Owner
Home Financials are based on the most recent Mortgage that was taken out on this home.
Original Mortgage
$192,318
Outstanding Balance
$114,536
Interest Rate
6.24%
Mortgage Type
Purchase Money Mortgage
Estimated Equity
$288,112
Purchase Details
Closed on
Mar 27, 2003
Sold by
Smutzer Brian R and Smutzer Kristie M
Bought by
Fitch Michael and Fitch Christina
Home Financials for this Owner
Home Financials are based on the most recent Mortgage that was taken out on this home.
Original Mortgage
$160,000
Interest Rate
4%
Mortgage Type
Purchase Money Mortgage
Purchase Details
Closed on
Sep 29, 1998
Sold by
Lakewood Valley Llc
Bought by
Smutzer Brian R and Smutzer Kristie M
Home Financials for this Owner
Home Financials are based on the most recent Mortgage that was taken out on this home.
Original Mortgage
$115,100
Interest Rate
6.97%
Create a Home Valuation Report for This Property
The Home Valuation Report is an in-depth analysis detailing your home's value as well as a comparison with similar homes in the area
Home Values in the Area
Average Home Value in this Area
Purchase History
| Date | Buyer | Sale Price | Title Company |
|---|---|---|---|
| Zegadlo Michael J | $241,000 | Attorneys Title Guaranty Fun | |
| Fitch Michael | $200,000 | Chicago Title Insurance Comp | |
| Smutzer Brian R | $159,500 | Chicago Title Insurance Co |
Source: Public Records
Mortgage History
| Date | Status | Borrower | Loan Amount |
|---|---|---|---|
| Open | Zegadlo Michael J | $192,318 | |
| Previous Owner | Fitch Michael | $160,000 | |
| Previous Owner | Smutzer Brian R | $115,100 | |
| Closed | Fitch Michael | $30,000 |
Source: Public Records
Tax History
| Year | Tax Paid | Tax Assessment Tax Assessment Total Assessment is a certain percentage of the fair market value that is determined by local assessors to be the total taxable value of land and additions on the property. | Land | Improvement |
|---|---|---|---|---|
| 2024 | $7,730 | $96,686 | $23,259 | $73,427 |
| 2023 | $7,730 | $85,412 | $20,547 | $64,865 |
| 2022 | $6,581 | $72,130 | $19,437 | $52,693 |
| 2021 | $6,531 | $68,695 | $18,511 | $50,184 |
| 2020 | $6,249 | $67,607 | $18,218 | $49,389 |
| 2019 | $6,309 | $65,702 | $17,705 | $47,997 |
| 2018 | $5,905 | $59,975 | $17,315 | $42,660 |
| 2017 | $5,838 | $58,427 | $16,868 | $41,559 |
| 2016 | $5,980 | $57,169 | $16,505 | $40,664 |
| 2015 | $5,963 | $54,970 | $15,870 | $39,100 |
| 2014 | $5,963 | $52,490 | $15,870 | $36,620 |
| 2013 | $5,963 | $52,490 | $15,870 | $36,620 |
Source: Public Records
Map
Nearby Homes
- 2812 Stuart Kaplan Ct
- 2413 Dickens Dr
- 2513 Dickens Dr
- 2503 Bayhill Ct
- 2969 Francis Ct
- 2722 Lahinch Dr
- 2662 Lahinch Dr
- 2263 Shiloh Dr Unit 2
- 9836 S Carls Dr
- 3017 Lundquist Dr
- 9623 S Carls Dr
- 2735 Hillsboro Blvd Unit 3
- 2723 Hillsboro Blvd
- 2125 Sunrise Cir Unit 27
- 2255 Georgetown Cir
- 2598 Hillsboro Blvd
- 3146 Peyton Cir
- 3144 Peyton Cir
- 2495 Hafenrichter Rd
- 2197 Wilson Creek Cir Unit 3
- 2685 Stuart Kaplan Dr Unit 2
- 2717 Stuart Kaplan Dr
- 2735 Squaw Valley Trail
- 2669 Stuart Kaplan Dr
- 2743 Squaw Valley Trail
- 2704 Stuart Kaplan Dr
- 2712 Stuart Kaplan Dr
- 2696 Stuart Kaplan Dr
- 2653 Stuart Kaplan Dr
- 2688 Stuart Kaplan Dr Unit 2
- 2720 Stuart Kaplan Dr
- 2751 Squaw Valley Trail
- 2680 Stuart Kaplan Dr
- 2724 Squaw Valley Trail Unit 2
- 2728 Squaw Valley Trail
- 2728 Stuart Kaplan Dr
- 2672 Stuart Kaplan Dr Unit 2
- 2732 Squaw Valley Trail
- 2714 Imperial Valley Trail
- 2740 Squaw Valley Trail
Your Personal Tour Guide
Ask me questions while you tour the home.