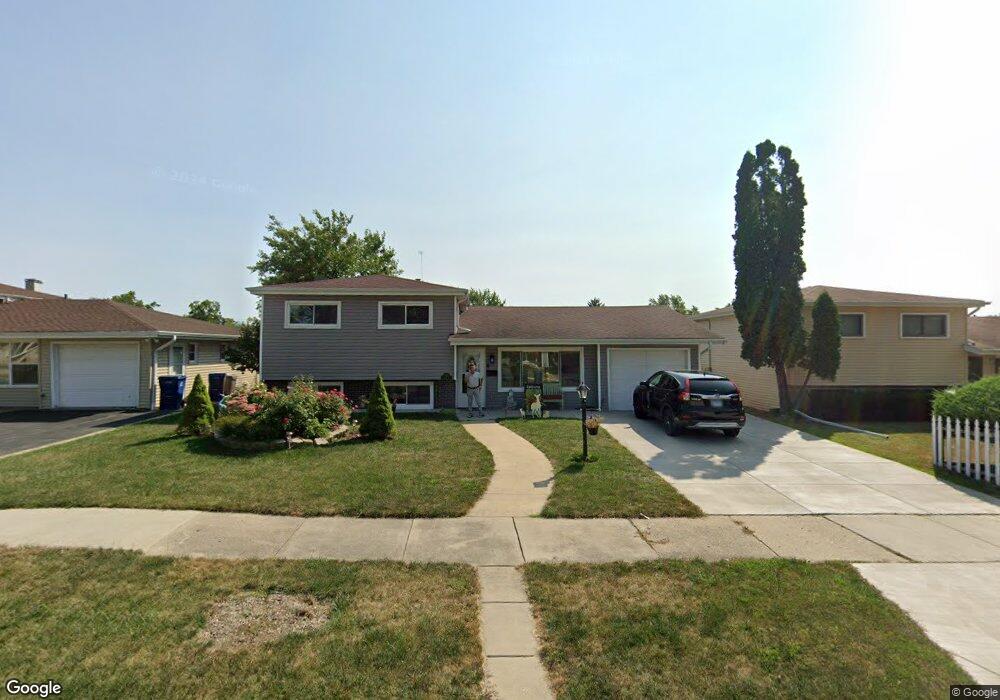
2709 Varonen Ave Waukegan, IL 60087
Estimated Value: $242,000 - $266,198
4
Beds
2
Baths
1,188
Sq Ft
$214/Sq Ft
Est. Value
About This Home
This home is located at 2709 Varonen Ave, Waukegan, IL 60087 and is currently estimated at $254,550, approximately $214 per square foot. 2709 Varonen Ave is a home located in Lake County with nearby schools including Oakdale Elementary School, Jack Benny Middle School, and Waukegan High School.
Ownership History
Date
Name
Owned For
Owner Type
Purchase Details
Closed on
Jul 7, 2008
Sold by
Buezo Concepcion and Buezo Nelson
Bought by
Buezo Nelson
Current Estimated Value
Purchase Details
Closed on
Dec 14, 2004
Sold by
Guerrero Alfredo and Perez Lucia
Bought by
Buezo Concepcion and Buezo Nelson
Home Financials for this Owner
Home Financials are based on the most recent Mortgage that was taken out on this home.
Original Mortgage
$167,170
Outstanding Balance
$84,220
Interest Rate
5.82%
Mortgage Type
FHA
Estimated Equity
$170,330
Purchase Details
Closed on
Jun 3, 1999
Sold by
Hartke Ronald L and Hartke Linda M
Bought by
Guerrero Alfredo and Perez Lucia
Home Financials for this Owner
Home Financials are based on the most recent Mortgage that was taken out on this home.
Original Mortgage
$124,284
Interest Rate
7.28%
Mortgage Type
FHA
Create a Home Valuation Report for This Property
The Home Valuation Report is an in-depth analysis detailing your home's value as well as a comparison with similar homes in the area
Home Values in the Area
Average Home Value in this Area
Purchase History
| Date | Buyer | Sale Price | Title Company |
|---|---|---|---|
| Buezo Nelson | -- | None Available | |
| Buezo Concepcion | $170,000 | -- | |
| Guerrero Alfredo | $125,000 | -- |
Source: Public Records
Mortgage History
| Date | Status | Borrower | Loan Amount |
|---|---|---|---|
| Open | Buezo Concepcion | $167,170 | |
| Previous Owner | Guerrero Alfredo | $124,284 |
Source: Public Records
Tax History Compared to Growth
Tax History
| Year | Tax Paid | Tax Assessment Tax Assessment Total Assessment is a certain percentage of the fair market value that is determined by local assessors to be the total taxable value of land and additions on the property. | Land | Improvement |
|---|---|---|---|---|
| 2024 | $5,604 | $74,849 | $11,573 | $63,276 |
| 2023 | $5,037 | $67,427 | $10,361 | $57,066 |
| 2022 | $5,037 | $57,525 | $10,452 | $47,073 |
| 2021 | $4,784 | $51,883 | $9,324 | $42,559 |
| 2020 | $4,799 | $48,335 | $8,686 | $39,649 |
| 2019 | $4,777 | $44,291 | $7,959 | $36,332 |
| 2018 | $4,801 | $43,515 | $10,294 | $33,221 |
| 2017 | $4,623 | $38,498 | $9,107 | $29,391 |
| 2016 | $3,860 | $30,976 | $7,328 | $23,648 |
| 2015 | $3,670 | $27,724 | $6,559 | $21,165 |
| 2014 | $3,370 | $25,455 | $6,519 | $18,936 |
| 2012 | $4,396 | $27,578 | $7,063 | $20,515 |
Source: Public Records
Map
Nearby Homes
- 2713 Varonen Ave
- 2705 Dana Ave
- 2708 Dana Ave
- 3032 W Vermont Ave
- 3320 Sunset Ave
- 12312 W Audrey Ave
- 2928 W Country Club Ave
- 3000 W Country Club Ave
- 2946 W Country Club Ave
- 36955 N Garrick Ave
- 1913 Chippewa Rd
- 2440 W Cheyenne Rd
- 2715 W Greenwood Ave
- 2350 N Lewis Ave
- 36245 N Green Bay Rd
- 2613 N Lewis Ave
- 2207 Williamsburg Dr
- 2810 W Atlantic Ave
- 12535 W Blanchard Rd
- 12933 W Polo Ave
- 2705 Varonen Ave
- 2701 Varonen Ave
- 2717 Varonen Ave
- 2721 Varonen Ave
- 2721 Varonen Ave
- 2653 Varonen Ave
- 2712 Varonen Ave
- 2706 Varonen Ave
- 2716 Varonen Ave
- 2700 Varonen Ave
- 2722 Varonen Ave
- 2649 Varonen Ave
- 2652 Varonen Ave
- 2730 Varonen Ave
- 2645 Varonen Ave
- 2648 Varonen Ave
- 2729 Varonen Ave
- 2736 Varonen Ave
- 2709 W Vermont Ave
- 2705 W Vermont Ave