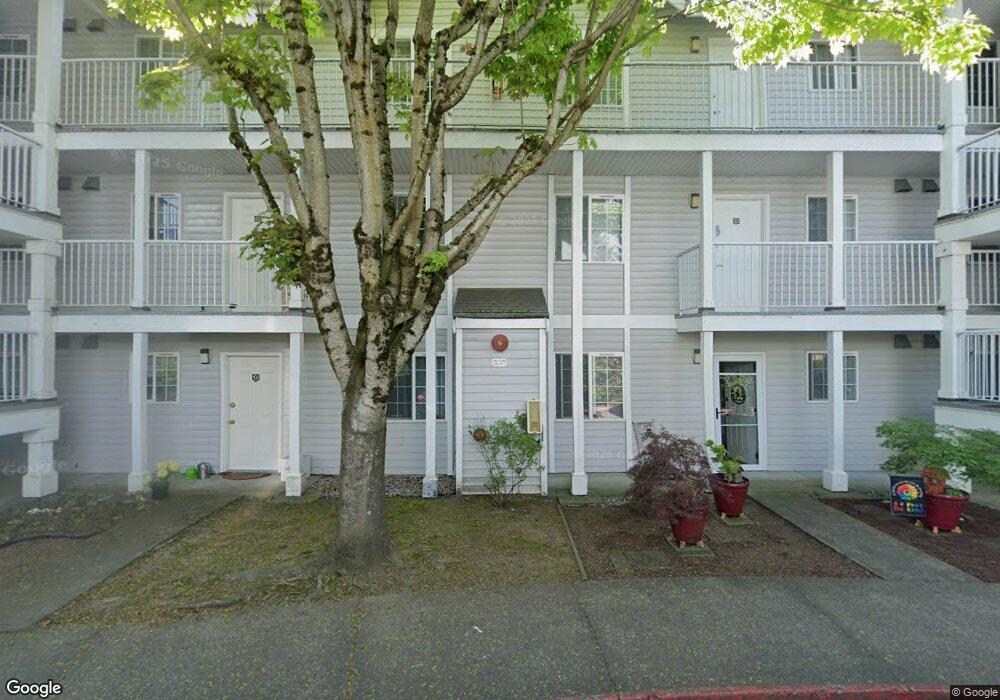
2709 W Maplewood Ave Unit 204 Bellingham, WA 98225
Birchwood NeighborhoodEstimated Value: $276,000 - $281,327
2
Beds
2
Baths
791
Sq Ft
$353/Sq Ft
Est. Value
About This Home
This home is located at 2709 W Maplewood Ave Unit 204, Bellingham, WA 98225 and is currently estimated at $278,832, approximately $352 per square foot. 2709 W Maplewood Ave Unit 204 is a home located in Whatcom County with nearby schools including Birchwood Elementary School, Shuksan Middle School, and Bellingham High School.
Ownership History
Date
Name
Owned For
Owner Type
Purchase Details
Closed on
Jun 24, 2016
Sold by
Whitten Marsh Tess
Bought by
Boyle Brian A and Plate Ann Marie
Current Estimated Value
Purchase Details
Closed on
May 21, 2010
Sold by
Leggitt Catherine Ann
Bought by
Whitten Marsh Tess
Home Financials for this Owner
Home Financials are based on the most recent Mortgage that was taken out on this home.
Original Mortgage
$126,200
Interest Rate
5.5%
Mortgage Type
FHA
Purchase Details
Closed on
Jul 11, 2007
Sold by
Maplewood Development Lp
Bought by
Leggitt Catherine Ann
Home Financials for this Owner
Home Financials are based on the most recent Mortgage that was taken out on this home.
Original Mortgage
$97,000
Interest Rate
6.41%
Mortgage Type
Purchase Money Mortgage
Create a Home Valuation Report for This Property
The Home Valuation Report is an in-depth analysis detailing your home's value as well as a comparison with similar homes in the area
Home Values in the Area
Average Home Value in this Area
Purchase History
| Date | Buyer | Sale Price | Title Company |
|---|---|---|---|
| Boyle Brian A | $115,000 | Chicago Title Insurance | |
| Whitten Marsh Tess | $128,180 | Whatcom Land Title | |
| Leggitt Catherine Ann | $133,280 | Chicago Title Insurance |
Source: Public Records
Mortgage History
| Date | Status | Borrower | Loan Amount |
|---|---|---|---|
| Previous Owner | Whitten Marsh Tess | $126,200 | |
| Previous Owner | Leggitt Catherine Ann | $97,000 |
Source: Public Records
Tax History Compared to Growth
Tax History
| Year | Tax Paid | Tax Assessment Tax Assessment Total Assessment is a certain percentage of the fair market value that is determined by local assessors to be the total taxable value of land and additions on the property. | Land | Improvement |
|---|---|---|---|---|
| 2024 | $1,932 | $247,785 | $38,228 | $209,557 |
| 2023 | $1,932 | $247,785 | $38,228 | $209,557 |
| 2022 | $1,686 | $223,230 | $34,440 | $188,790 |
| 2021 | $1,455 | $181,488 | $28,000 | $153,488 |
| 2020 | $1,388 | $147,879 | $38,580 | $109,299 |
| 2019 | $1,214 | $136,295 | $35,558 | $100,737 |
| 2018 | $1,222 | $119,545 | $31,188 | $88,357 |
| 2017 | $1,069 | $102,883 | $26,841 | $76,042 |
| 2016 | $962 | $94,067 | $24,541 | $69,526 |
| 2015 | $863 | $88,160 | $23,000 | $65,160 |
| 2014 | -- | $76,527 | $21,140 | $55,387 |
| 2013 | -- | $71,097 | $19,640 | $51,457 |
Source: Public Records
Map
Nearby Homes
- 2715 W Maplewood Ave Unit 122
- 2713 W Maplewood Ave Unit 311
- 2829 Cottonwood Ave
- 3330 Northwest Ave
- 3352 Northwest Ave Unit 2101
- 3350 Northwest Ave Unit 1102
- 2850 W Maplewood Ave
- 2721 Mcleod Rd
- 2817 Mcleod Rd
- 2833 Mcleod Rd
- 1508 E Maplewood Ave
- 2710 Mcleod Rd
- 2705 W Maryland St
- 2812 Nome St
- 3085 W Maplewood Ave
- 3132 Alderwood Ave
- 3057 Mcleod Rd
- 4015 Eliza Ave Unit 31
- 4015 Eliza Ave Unit 120
- 3008 Meridian St
- 2709 W Maplewood Ave
- 2709 W Maplewood Ave Unit 303
- 2709 W Maplewood Ave Unit 302
- 2709 W Maplewood Ave Unit 301
- 2709 W Maplewood Ave Unit 203
- 2709 W Maplewood Ave Unit 202
- 2709 W Maplewood Ave Unit 201
- 2709 W Maplewood Ave Unit 104
- 2709 W Maplewood Ave Unit 103
- 2709 W Maplewood Ave Unit 102
- 2709 W Maplewood Ave Unit 101
- 2705 W Maplewood Ave
- 2705 W Maplewood Ave Unit 1
- 2701 W Maplewood Ave
- 2717 W Maplewood Ave
- 3247 Partridge Ln Unit 3
- 3247 Partridge Ln Unit 2
- 3247 Partridge Ln Unit 2 D
- 3247 Partridge Ln Unit 1-6