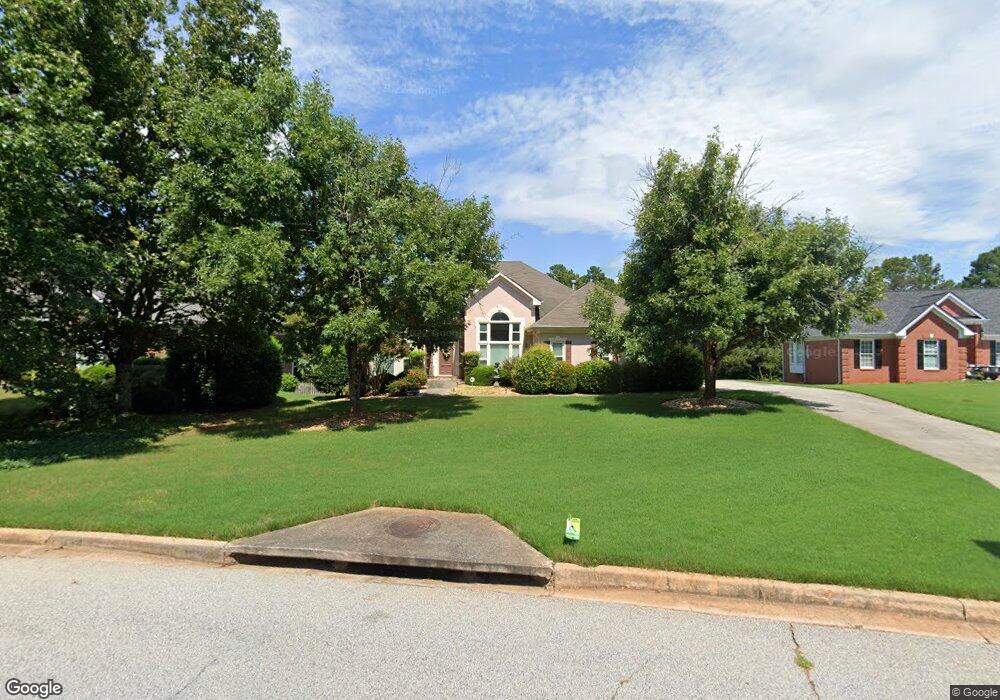
2709 Whitecrest Cir SE Conyers, GA 30013
Estimated Value: $372,000 - $470,000
4
Beds
3
Baths
2,345
Sq Ft
$177/Sq Ft
Est. Value
About This Home
This home is located at 2709 Whitecrest Cir SE, Conyers, GA 30013 and is currently estimated at $414,497, approximately $176 per square foot. 2709 Whitecrest Cir SE is a home located in Rockdale County with nearby schools including Peek's Chapel Elementary School, Memorial Middle School, and Salem High School.
Ownership History
Date
Name
Owned For
Owner Type
Purchase Details
Closed on
May 24, 2016
Sold by
Ehrig Sandra
Bought by
Thomas Toney L and Price Debbie A
Current Estimated Value
Home Financials for this Owner
Home Financials are based on the most recent Mortgage that was taken out on this home.
Original Mortgage
$229,842
Outstanding Balance
$182,970
Interest Rate
3.66%
Estimated Equity
$231,527
Purchase Details
Closed on
Sep 21, 2007
Sold by
Gailey Barbara T
Bought by
Ehrig Ramon J and Ehrig Sandra
Home Financials for this Owner
Home Financials are based on the most recent Mortgage that was taken out on this home.
Original Mortgage
$160,000
Interest Rate
6.49%
Purchase Details
Closed on
Sep 20, 1999
Sold by
Gailey Anthony K
Bought by
Gailey Barbara T
Purchase Details
Closed on
Apr 28, 1995
Sold by
Mathis Builders Inc
Bought by
Gailey Anthony K Barbara and T
Create a Home Valuation Report for This Property
The Home Valuation Report is an in-depth analysis detailing your home's value as well as a comparison with similar homes in the area
Home Values in the Area
Average Home Value in this Area
Purchase History
| Date | Buyer | Sale Price | Title Company |
|---|---|---|---|
| Thomas Toney L | $222,500 | -- | |
| Ehrig Ramon J | $244,000 | -- | |
| Gailey Barbara T | -- | -- | |
| Gailey Anthony K Barbara | $183,900 | -- |
Source: Public Records
Mortgage History
| Date | Status | Borrower | Loan Amount |
|---|---|---|---|
| Open | Thomas Toney L | $229,842 | |
| Previous Owner | Ehrig Ramon J | $160,000 | |
| Closed | Gailey Anthony K Barbara | $0 |
Source: Public Records
Tax History Compared to Growth
Tax History
| Year | Tax Paid | Tax Assessment Tax Assessment Total Assessment is a certain percentage of the fair market value that is determined by local assessors to be the total taxable value of land and additions on the property. | Land | Improvement |
|---|---|---|---|---|
| 2024 | $3,493 | $167,680 | $34,720 | $132,960 |
| 2023 | $3,202 | $163,120 | $34,720 | $128,400 |
| 2022 | $2,736 | $132,680 | $21,640 | $111,040 |
| 2021 | $2,373 | $112,560 | $21,640 | $90,920 |
| 2020 | $3,006 | $114,480 | $21,800 | $92,680 |
| 2019 | $2,439 | $93,640 | $13,200 | $80,440 |
| 2018 | $2,455 | $93,640 | $13,200 | $80,440 |
| 2017 | $2,198 | $84,400 | $13,200 | $71,200 |
| 2016 | $3,139 | $68,520 | $13,200 | $55,320 |
| 2015 | $1,390 | $62,200 | $13,200 | $49,000 |
| 2014 | $1,176 | $59,560 | $10,560 | $49,000 |
| 2013 | -- | $76,320 | $13,560 | $62,760 |
Source: Public Records
Map
Nearby Homes
- 3226 Old Salem Rd SE
- 3111 Green Gate Way SE
- 2638 Westchester Pkwy SE
- 2585 Westchester Way SE
- 3225 Haleys Way SE
- 2335 Ettas Cir SE
- 2323 Benji Blvd SE
- 3222 Haleys Way SE
- 3205 Haleys Way SE
- 3113 Brians Creek Dr SE
- 3240 Somerset Ct SE
- 3106 Brians Creek Dr SE
- 3296 Haverhill Ct SE
- 3095 Brombley Dr SE
- 2052 Evergreen Dr SE
- 3766 Windy Hill Dr SE Unit 2
- 3210 Spring Way SE
- 1406 Windy Ridge Ct SE
- 2707 Whitecrest Cir SE
- 2711 Whitecrest Cir SE
- 2705 Whitecrest Cir SE
- 0 Westchester Way SE Unit 3129821
- 0 Westchester Way SE Unit 7244585
- 0 Westchester Way SE Unit 8960583
- 0 Westchester Way SE Unit 42 8231479
- 0 Westchester Way SE Unit 3171582
- 0 Westchester Way SE Unit 7121622
- 0 Westchester Way SE Unit 7307024
- 2713 Whitecrest Cir SE
- 2706 Whitecrest Cir SE
- 2708 Whitecrest Cir SE Unit 5
- 2708 Whitecrest Cir SE
- 2715 Whitecrest Cir SE
- 2703 Whitecrest Cir SE
- 2704 Whitecrest Cir SE
- 2800 Clearwater Terrace SE
- 2717 Whitecrest Cir SE
- 2710 Whitecrest Cir SE