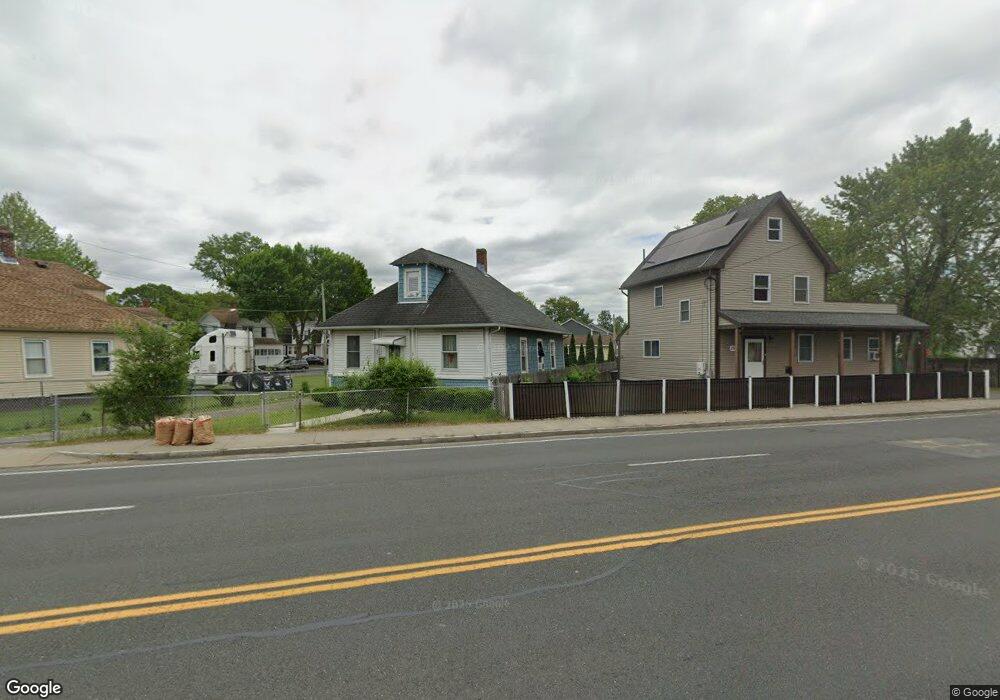
271 Boston Rd Springfield, MA 01109
Pine Point NeighborhoodEstimated Value: $175,000 - $281,000
3
Beds
1
Bath
856
Sq Ft
$253/Sq Ft
Est. Value
About This Home
This home is located at 271 Boston Rd, Springfield, MA 01109 and is currently estimated at $216,338, approximately $252 per square foot. 271 Boston Rd is a home located in Hampden County with nearby schools including Thomas M Balliet Elementary School, John J Duggan Middle, and Roger L. Putnam Vocational Technical Academy.
Ownership History
Date
Name
Owned For
Owner Type
Purchase Details
Closed on
Jul 28, 2017
Sold by
Cortez Crisanta A
Bought by
Cortez Crisanta A and Cortez-Demanche Victoria
Current Estimated Value
Purchase Details
Closed on
Oct 29, 2007
Sold by
Us Bk
Bought by
Cortez Crisanta A
Home Financials for this Owner
Home Financials are based on the most recent Mortgage that was taken out on this home.
Original Mortgage
$50,000
Interest Rate
6.39%
Mortgage Type
Purchase Money Mortgage
Purchase Details
Closed on
Nov 15, 2006
Sold by
Rame Joseph M and Us Bank Na
Bought by
Us Bank Na
Purchase Details
Closed on
Aug 23, 2002
Sold by
Valentin Eduardo
Bought by
Rame Joseph M
Home Financials for this Owner
Home Financials are based on the most recent Mortgage that was taken out on this home.
Original Mortgage
$53,541
Interest Rate
6.57%
Mortgage Type
Purchase Money Mortgage
Create a Home Valuation Report for This Property
The Home Valuation Report is an in-depth analysis detailing your home's value as well as a comparison with similar homes in the area
Home Values in the Area
Average Home Value in this Area
Purchase History
| Date | Buyer | Sale Price | Title Company |
|---|---|---|---|
| Cortez Crisanta A | -- | -- | |
| Cortez Crisanta A | $66,100 | -- | |
| Us Bank Na | $53,250 | -- | |
| Rame Joseph M | $54,000 | -- |
Source: Public Records
Mortgage History
| Date | Status | Borrower | Loan Amount |
|---|---|---|---|
| Previous Owner | Cortez Crisanta A | $50,000 | |
| Previous Owner | Rame Joseph M | $53,541 | |
| Previous Owner | Rame Joseph M | $5,797 |
Source: Public Records
Tax History
| Year | Tax Paid | Tax Assessment Tax Assessment Total Assessment is a certain percentage of the fair market value that is determined by local assessors to be the total taxable value of land and additions on the property. | Land | Improvement |
|---|---|---|---|---|
| 2025 | $1,290 | $82,300 | $39,800 | $42,500 |
| 2024 | $1,436 | $89,400 | $33,200 | $56,200 |
| 2023 | $1,326 | $77,800 | $30,200 | $47,600 |
| 2022 | $1,236 | $65,700 | $28,200 | $37,500 |
| 2021 | $1,338 | $70,800 | $25,700 | $45,100 |
| 2020 | $1,494 | $76,500 | $25,700 | $50,800 |
| 2019 | $1,289 | $65,500 | $25,700 | $39,800 |
| 2018 | $1,108 | $56,300 | $25,700 | $30,600 |
| 2017 | $1,064 | $54,100 | $23,700 | $30,400 |
| 2016 | $1,032 | $52,500 | $23,700 | $28,800 |
| 2015 | $1,056 | $53,700 | $23,700 | $30,000 |
Source: Public Records
Map
Nearby Homes
Your Personal Tour Guide
Ask me questions while you tour the home.