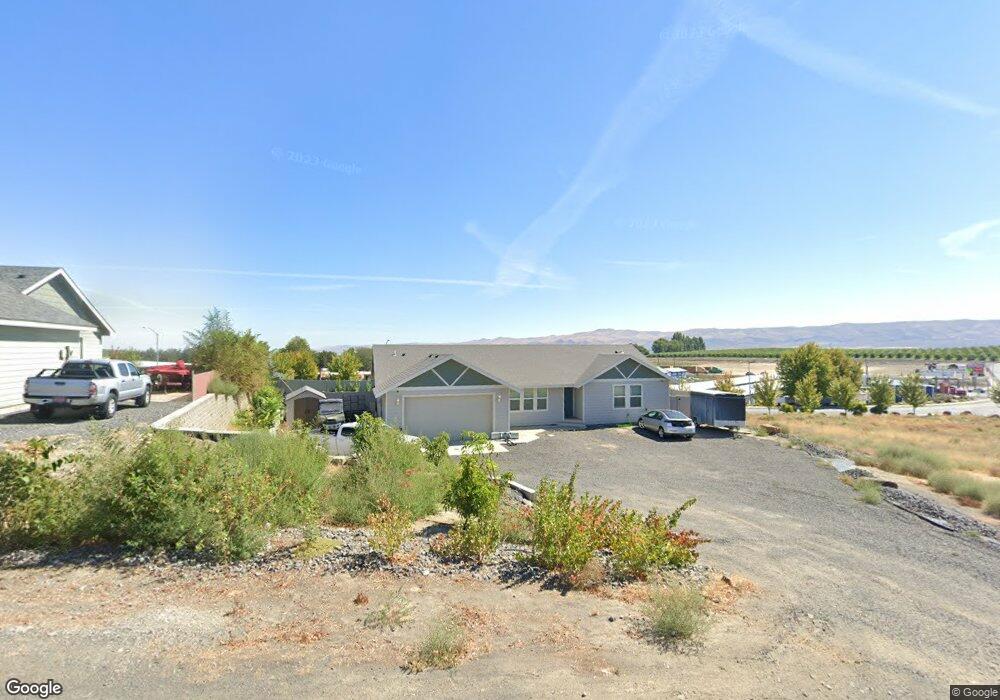
271 Calla Loop NW Royal City, WA 99357
Estimated Value: $332,000 - $422,000
3
Beds
2
Baths
1,603
Sq Ft
$226/Sq Ft
Est. Value
About This Home
This home is located at 271 Calla Loop NW, Royal City, WA 99357 and is currently estimated at $361,544, approximately $225 per square foot. 271 Calla Loop NW is a home with nearby schools including Red Rock Elementary School, Royal Middle School, and Royal High School.
Ownership History
Date
Name
Owned For
Owner Type
Purchase Details
Closed on
Dec 16, 2020
Sold by
Wright Michael D and Wright Samantha M
Bought by
Vargas Neil
Current Estimated Value
Home Financials for this Owner
Home Financials are based on the most recent Mortgage that was taken out on this home.
Original Mortgage
$242,500
Outstanding Balance
$215,897
Interest Rate
2.7%
Mortgage Type
New Conventional
Estimated Equity
$145,647
Purchase Details
Closed on
Dec 10, 2015
Sold by
Verhey Paul A and Verhey Joann L
Bought by
Wright Michael D and Wright Samantha M
Home Financials for this Owner
Home Financials are based on the most recent Mortgage that was taken out on this home.
Original Mortgage
$205,704
Interest Rate
3.83%
Mortgage Type
FHA
Purchase Details
Closed on
Feb 15, 2013
Sold by
Guadalupe Llc
Bought by
Verhey Paul A and Verhey Joann L
Create a Home Valuation Report for This Property
The Home Valuation Report is an in-depth analysis detailing your home's value as well as a comparison with similar homes in the area
Home Values in the Area
Average Home Value in this Area
Purchase History
| Date | Buyer | Sale Price | Title Company |
|---|---|---|---|
| Vargas Neil | $250,000 | Stewart Title | |
| Wright Michael D | $209,500 | Stewart Title | |
| Verhey Paul A | -- | Grant County Title |
Source: Public Records
Mortgage History
| Date | Status | Borrower | Loan Amount |
|---|---|---|---|
| Open | Vargas Neil | $242,500 | |
| Previous Owner | Wright Michael D | $205,704 |
Source: Public Records
Tax History Compared to Growth
Tax History
| Year | Tax Paid | Tax Assessment Tax Assessment Total Assessment is a certain percentage of the fair market value that is determined by local assessors to be the total taxable value of land and additions on the property. | Land | Improvement |
|---|---|---|---|---|
| 2024 | $2,803 | $275,976 | $63,400 | $212,576 |
| 2023 | $2,680 | $240,700 | $40,625 | $200,075 |
| 2022 | $2,806 | $240,700 | $40,625 | $200,075 |
| 2021 | $2,117 | $240,700 | $40,625 | $200,075 |
| 2020 | $2,189 | $176,950 | $53,000 | $123,950 |
| 2019 | $1,959 | $183,435 | $53,000 | $130,435 |
| 2018 | $2,202 | $192,340 | $53,000 | $139,340 |
| 2017 | $2,283 | $202,570 | $20,000 | $182,570 |
| 2016 | $1,543 | $130,190 | $20,000 | $110,190 |
| 2013 | -- | $20,000 | $20,000 | $0 |
Source: Public Records
Map
Nearby Homes
- 278 Calla Loop NW
- 0 Lot 24 Poplar St
- 0 Lot 25 Poplar St
- 0 Lot 26 Poplar St
- 2236 Road 13 SW
- 0 Red Rock Field Unit NWM2381752
- 0 Parcel 10 Road 13 6 SW
- 0 Parcel 3 Road B 9 SW
- 0 Lot 2 Road B 9 SW
- 0 Parcel 1 Road B 9 SW
- 0 Parcel SW
- 0 Parcel 12 Road B 9 SW
- 0 Parcel 5 Road B 9 SW
- 0 Parcel 11 Road B 9 SW
- 14092 Crook Loop SW
- 6 Road 13 SW
- 12078 Division Rd S
- 11186 C Rd SE
- 0 Wahluke Rd SW
- 23547 Road K SW
- 275 Calla Loop NW
- 267 Calla Loop NW
- 272 Calla Loop NW
- 263 Calla Loop NW
- 266 Calla Loop NW
- 283 Calla St
- 259 Calla Loop NW
- 255 Calla Loop NW
- 284 Calla Loop NW
- 154 NW Blue Bell Dr
- 145 Daisy St NW
- 291 Calla Loop NW
- 229 Calla Loop NW
- 290 Calla Loop NW
- 120 Evergreen Ave NW
- 248 Calla Loop NW
- 217 Calla Loop NW
- 139 Daisy St NW
- 120 NW Royal Ave
- 236 Calla Loop NW