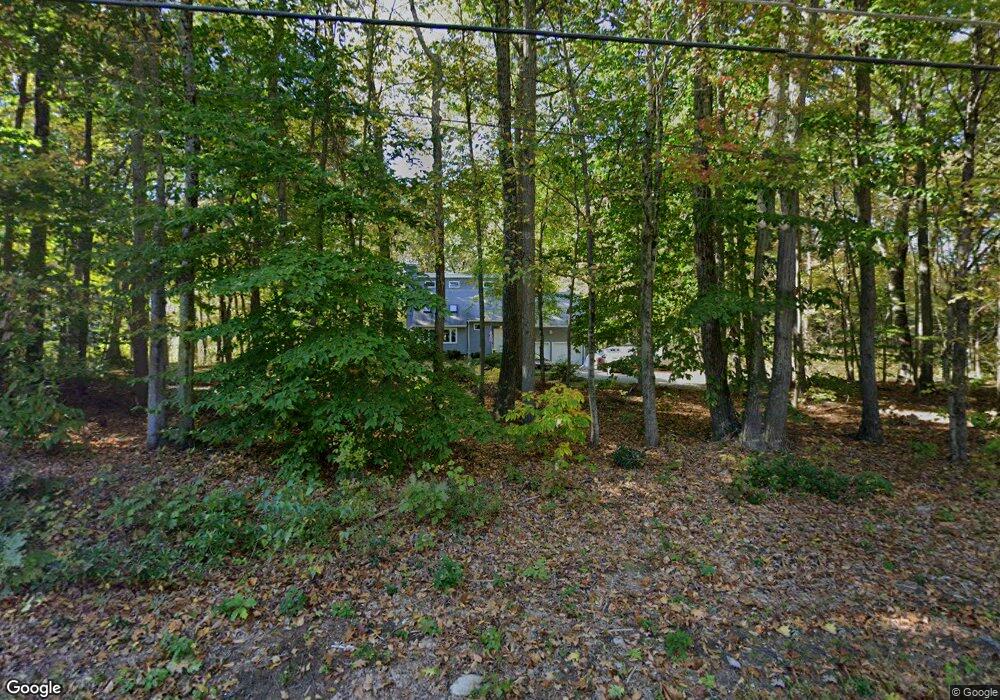
271 Cedar Swamp Rd Coventry, CT 06238
Estimated Value: $456,000 - $531,000
4
Beds
3
Baths
2,040
Sq Ft
$246/Sq Ft
Est. Value
About This Home
This home is located at 271 Cedar Swamp Rd, Coventry, CT 06238 and is currently estimated at $501,726, approximately $245 per square foot. 271 Cedar Swamp Rd is a home located in Tolland County with nearby schools including Coventry Grammar School, George Hersey Robertson School, and Capt. Nathan Hale School.
Ownership History
Date
Name
Owned For
Owner Type
Purchase Details
Closed on
Jun 24, 2023
Sold by
Hull Kimberly A
Bought by
Hull Jessica A
Current Estimated Value
Purchase Details
Closed on
Dec 27, 2005
Sold by
Labelle Debra
Bought by
Hull Kimberly A and Hull Raymond H
Purchase Details
Closed on
Jun 30, 2004
Sold by
Obrien Aileen and Warburton Michael
Bought by
Labelle William and Labelle Debra
Purchase Details
Closed on
Jul 29, 2002
Sold by
Gagliardi Anthony
Bought by
Obrien Aileen and Warburton Michael
Purchase Details
Closed on
Nov 15, 1999
Sold by
Haun William and Haun Lisa
Bought by
Gagliardi Anthony and Gagliardi Theodora
Purchase Details
Closed on
Dec 19, 1989
Sold by
Doerr William
Bought by
Haun William
Create a Home Valuation Report for This Property
The Home Valuation Report is an in-depth analysis detailing your home's value as well as a comparison with similar homes in the area
Home Values in the Area
Average Home Value in this Area
Purchase History
| Date | Buyer | Sale Price | Title Company |
|---|---|---|---|
| Hull Jessica A | -- | None Available | |
| Hull Kimberly A | -- | None Available | |
| Hull Jessica A | -- | None Available | |
| Hull Kimberly A | -- | None Available | |
| Hull Kimberly A | $305,000 | -- | |
| Labelle William | $293,000 | -- | |
| Obrien Aileen | $237,000 | -- | |
| Gagliardi Anthony | $189,000 | -- | |
| Hull Kimberly A | $305,000 | -- | |
| Labelle William | $293,000 | -- | |
| Obrien Aileen | $237,000 | -- | |
| Gagliardi Anthony | $189,000 | -- | |
| Haun William | $60,000 | -- |
Source: Public Records
Mortgage History
| Date | Status | Borrower | Loan Amount |
|---|---|---|---|
| Previous Owner | Haun William | $309,384 | |
| Previous Owner | Haun William | $318,865 |
Source: Public Records
Tax History
| Year | Tax Paid | Tax Assessment Tax Assessment Total Assessment is a certain percentage of the fair market value that is determined by local assessors to be the total taxable value of land and additions on the property. | Land | Improvement |
|---|---|---|---|---|
| 2025 | $7,449 | $313,500 | $62,000 | $251,500 |
| 2024 | $6,809 | $204,400 | $51,200 | $153,200 |
| 2023 | $6,488 | $204,400 | $51,200 | $153,200 |
| 2022 | $6,367 | $204,400 | $51,200 | $153,200 |
| 2021 | $6,367 | $204,400 | $51,200 | $153,200 |
| 2020 | $6,371 | $204,400 | $51,200 | $153,200 |
| 2019 | $6,585 | $204,500 | $51,200 | $153,300 |
| 2018 | $6,038 | $187,500 | $51,200 | $136,300 |
| 2017 | $6,000 | $187,500 | $51,200 | $136,300 |
| 2016 | $5,850 | $187,500 | $51,200 | $136,300 |
| 2015 | $5,850 | $187,500 | $51,200 | $136,300 |
| 2014 | $5,643 | $198,200 | $62,400 | $135,800 |
Source: Public Records
Map
Nearby Homes
- 5 Laurelwood Ln Unit lot 16
- 23 Neville St
- 7 Laurelwood Ln Unit Lot 15
- 12 Laurelwood Ln Unit lot 8
- 939 Boston Turnpike
- 61 Stone Hedge Ln
- 0 Boston Turnpike Unit 24128587
- 279 Mark Dr
- 687 Hop River Rd
- 25 Wolf Hill Rd
- 93 Dockerel Rd
- 151 Pine Hill Rd
- 37 Wolf Hill Rd Unit Lot 40
- 37 Wolf Hill Lot (#40) Rd
- 395 Grant Hill (Mill Race Drive) Lot #21 Rd
- 395 Grant Hill Rd Unit Lot21
- 361 Dunn Rd
- 16 Higgins Way
- 2 Vine Dr
- 612 Broad Way
- 285 Cedar Swamp Rd
- 276 Cedar Swamp Rd
- 250 Cedar Swamp Rd
- 260 Cedar Swamp Rd
- 307 Cedar Swamp Rd
- 293 Cedar Swamp Rd
- 219 Cedar Swamp Rd
- 300 Cedar Swamp Rd
- 209 Cedar Swamp Rd
- 299 Cedar Swamp Rd
- 240 Cedar Swamp Rd
- 319 Cedar Swamp Rd
- 201 Cedar Swamp Rd
- 228 Cedar Swamp Rd
- 341 Cedar Swamp Rd
- 181 Cedar Swamp Rd
- 18 Sunset Ln Unit 2B
- 15 Sunset Ln
- 351 Cedar Swamp Rd
- 361 Cedar Swamp Rd
Your Personal Tour Guide
Ask me questions while you tour the home.