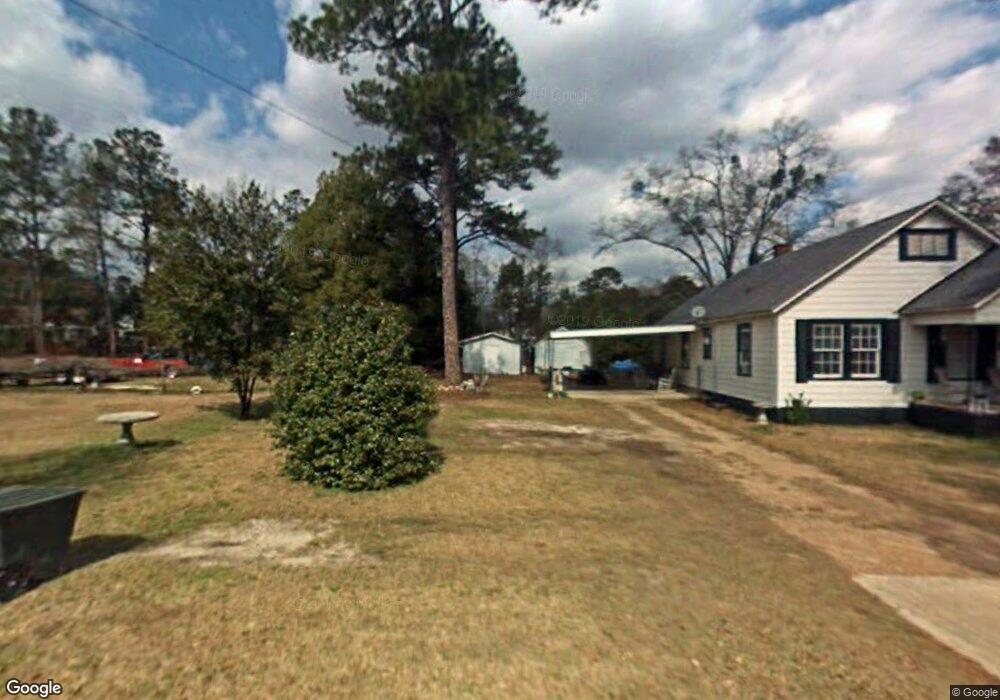
271 College St Blakely, GA 39823
Estimated Value: $95,662 - $145,000
--
Bed
1
Bath
1,630
Sq Ft
$73/Sq Ft
Est. Value
About This Home
This home is located at 271 College St, Blakely, GA 39823 and is currently estimated at $118,916, approximately $72 per square foot. 271 College St is a home located in Early County with nearby schools including Early County Elementary School, Early County Middle School, and Early County High School.
Ownership History
Date
Name
Owned For
Owner Type
Purchase Details
Closed on
Apr 20, 2016
Sold by
Crozier Richard T
Bought by
Price Gracie Roberts
Current Estimated Value
Home Financials for this Owner
Home Financials are based on the most recent Mortgage that was taken out on this home.
Original Mortgage
$12,982
Interest Rate
3.71%
Mortgage Type
New Conventional
Purchase Details
Closed on
Jul 16, 2004
Sold by
Wade Katherine Graha
Bought by
Crozier Richard T and Crozier Frances W
Purchase Details
Closed on
Feb 7, 2001
Sold by
Craig Louise S
Bought by
Wade Katherine Graha
Purchase Details
Closed on
Sep 23, 1999
Sold by
Snyder Billie H
Bought by
Craig Louise S
Purchase Details
Closed on
Sep 5, 1997
Sold by
Snyder Ann Albritton
Bought by
Snyder Billie H
Purchase Details
Closed on
Dec 5, 1994
Bought by
Snyder Ann Albritton
Create a Home Valuation Report for This Property
The Home Valuation Report is an in-depth analysis detailing your home's value as well as a comparison with similar homes in the area
Home Values in the Area
Average Home Value in this Area
Purchase History
| Date | Buyer | Sale Price | Title Company |
|---|---|---|---|
| Price Gracie Roberts | $38,000 | -- | |
| Crozier Richard T | $25,000 | -- | |
| Wade Katherine Graha | $45,000 | -- | |
| Craig Louise S | $45,000 | -- | |
| Snyder Billie H | -- | -- | |
| Snyder Ann Albritton | -- | -- |
Source: Public Records
Mortgage History
| Date | Status | Borrower | Loan Amount |
|---|---|---|---|
| Closed | Price Gracie Roberts | $12,982 |
Source: Public Records
Tax History Compared to Growth
Tax History
| Year | Tax Paid | Tax Assessment Tax Assessment Total Assessment is a certain percentage of the fair market value that is determined by local assessors to be the total taxable value of land and additions on the property. | Land | Improvement |
|---|---|---|---|---|
| 2024 | $542 | $24,146 | $2,890 | $21,256 |
| 2023 | $665 | $24,146 | $2,890 | $21,256 |
| 2022 | $529 | $22,961 | $2,890 | $20,071 |
| 2021 | $482 | $20,925 | $2,890 | $18,035 |
| 2020 | $473 | $20,925 | $2,890 | $18,035 |
| 2019 | $407 | $17,815 | $2,890 | $14,925 |
| 2018 | $472 | $17,472 | $2,890 | $14,582 |
| 2017 | $405 | $17,472 | $2,890 | $14,582 |
| 2016 | $547 | $18,278 | $2,890 | $15,388 |
| 2015 | -- | $18,292 | $2,890 | $15,403 |
| 2014 | -- | $17,469 | $2,890 | $14,579 |
| 2013 | -- | $17,769 | $2,890 | $14,879 |
Source: Public Records
Map
Nearby Homes
- 234 College St
- 337 College St
- 73 W Westward Ave
- 76 S Jefferson Ave
- 73 Grove Place
- 556 Flowers Dr
- 600 Chattahoochee Ave
- 8 Lots Unknown Ln
- 21 E Railroad Ln
- 1827 Tarver Dr
- 0000 Martin Luther King Junior Blvd
- Stein Rd
- 74 S Lancelot St
- 000 Georgia 62
- 115 S Central Ave
- 182 S Central Ave
- 18802 E South Blvd
- 16 Woodlawn Dr
- 507 Lakewood Dr
- 00 N Woodlawn Dr