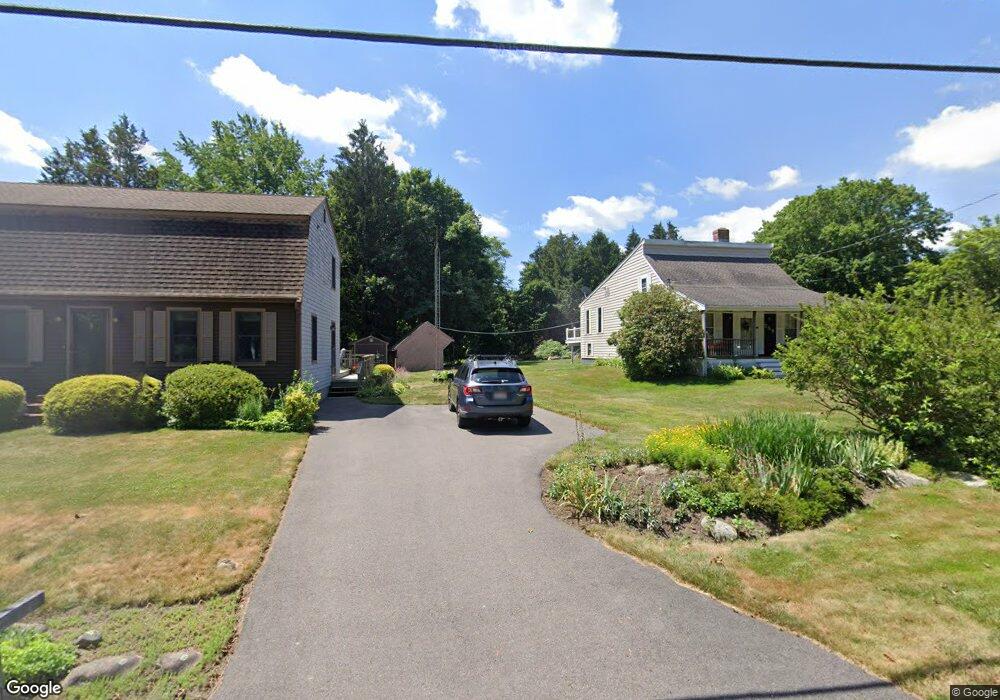
271 Crescent St East Bridgewater, MA 02333
Estimated Value: $557,089 - $626,000
3
Beds
2
Baths
1,536
Sq Ft
$389/Sq Ft
Est. Value
About This Home
This home is located at 271 Crescent St, East Bridgewater, MA 02333 and is currently estimated at $596,772, approximately $388 per square foot. 271 Crescent St is a home located in Plymouth County with nearby schools including Central Elementary School, Gordon W Mitchell Middle School, and East Bridgewater Jr./Sr. High School.
Ownership History
Date
Name
Owned For
Owner Type
Purchase Details
Closed on
May 26, 2000
Sold by
Obrien James P and Obrien Elaine M
Bought by
Tatjana Perkins Mark E and Tatjana Chorosko
Current Estimated Value
Home Financials for this Owner
Home Financials are based on the most recent Mortgage that was taken out on this home.
Original Mortgage
$172,000
Interest Rate
8.1%
Mortgage Type
Purchase Money Mortgage
Create a Home Valuation Report for This Property
The Home Valuation Report is an in-depth analysis detailing your home's value as well as a comparison with similar homes in the area
Home Values in the Area
Average Home Value in this Area
Purchase History
| Date | Buyer | Sale Price | Title Company |
|---|---|---|---|
| Tatjana Perkins Mark E | $215,000 | -- |
Source: Public Records
Mortgage History
| Date | Status | Borrower | Loan Amount |
|---|---|---|---|
| Open | Tatjana Perkins Mark E | $164,500 | |
| Closed | Tatjana Perkins Mark E | $172,000 | |
| Previous Owner | Tatjana Perkins Mark E | $123,000 | |
| Previous Owner | Tatjana Perkins Mark E | $120,000 |
Source: Public Records
Tax History Compared to Growth
Tax History
| Year | Tax Paid | Tax Assessment Tax Assessment Total Assessment is a certain percentage of the fair market value that is determined by local assessors to be the total taxable value of land and additions on the property. | Land | Improvement |
|---|---|---|---|---|
| 2025 | $6,410 | $468,900 | $169,800 | $299,100 |
| 2024 | $6,261 | $452,400 | $163,300 | $289,100 |
| 2023 | $6,167 | $426,800 | $163,300 | $263,500 |
| 2022 | $5,975 | $383,000 | $148,500 | $234,500 |
| 2021 | $5,826 | $341,700 | $142,700 | $199,000 |
| 2020 | $5,720 | $330,800 | $137,200 | $193,600 |
| 2019 | $5,584 | $318,000 | $131,200 | $186,800 |
| 2018 | $5,361 | $298,500 | $131,200 | $167,300 |
| 2017 | $5,239 | $286,300 | $125,100 | $161,200 |
| 2016 | $5,079 | $279,700 | $125,100 | $154,600 |
| 2015 | $4,928 | $277,500 | $124,200 | $153,300 |
| 2014 | $4,756 | $273,800 | $121,600 | $152,200 |
Source: Public Records
Map
Nearby Homes
- 587 Bridge St
- 28 Brookbend Way E
- 182 Crystal Water Dr Unit 182
- 217 Crystal Water Dr
- 51 Stonegate Dr
- 26 Meadowbrook Dr
- 78 Crystal Water Dr
- 71 Stonegate Dr
- 1993 Washington St
- 1 Simmons Place
- 2045 Washington St
- 94 Pond St
- 1247 Central St
- 936 Central St
- 29 Hayes Rd
- 455 Plymouth St
- 121 South St
- 14 Mountain Ash Rd
- 844 Washington St
- 261 Plymouth St
- 283 Crescent St
- 259 Crescent St
- 268 Crescent St
- 249 Crescent St
- 246 Crescent St
- 285 Crescent St
- 284 Crescent St
- 280 Crescent St
- 241 Crescent St
- 295 Crescent St
- 244 Crescent St
- 294 Crescent St
- 92 Crescent St
- 304 Crescent St
- 229 Crescent St
- 232 Crescent St
- 309 Crescent St
- 220 Crescent St
- 215 Crescent St
- 314 Crescent St