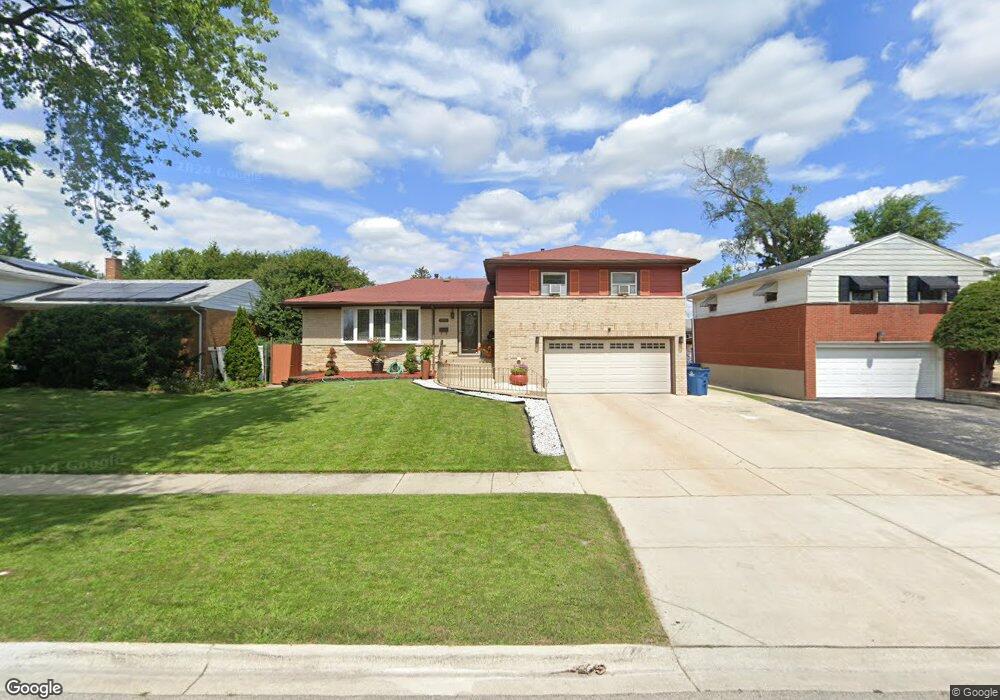
271 Division St Melrose Park, IL 60160
North Maywood NeighborhoodEstimated Value: $401,000 - $424,187
3
Beds
3
Baths
1,918
Sq Ft
$212/Sq Ft
Est. Value
About This Home
This home is located at 271 Division St, Melrose Park, IL 60160 and is currently estimated at $407,547, approximately $212 per square foot. 271 Division St is a home located in Cook County with nearby schools including Jane Addams Elementary School, Stevenson Middle School, and Proviso East High School.
Ownership History
Date
Name
Owned For
Owner Type
Purchase Details
Closed on
Nov 8, 2005
Sold by
Canelo Jose F
Bought by
Canelo Jose F and Canelo Maria
Current Estimated Value
Home Financials for this Owner
Home Financials are based on the most recent Mortgage that was taken out on this home.
Original Mortgage
$248,000
Outstanding Balance
$136,961
Interest Rate
6.17%
Mortgage Type
Fannie Mae Freddie Mac
Estimated Equity
$270,586
Purchase Details
Closed on
Apr 15, 2003
Sold by
Hall Pauline J
Bought by
Tran Phuong N and Tran Alicia L
Home Financials for this Owner
Home Financials are based on the most recent Mortgage that was taken out on this home.
Original Mortgage
$193,500
Interest Rate
5.86%
Mortgage Type
Purchase Money Mortgage
Purchase Details
Closed on
Oct 10, 1997
Sold by
Naranjo Humberto and Naranjo Amelia
Bought by
Hall Cassandra
Home Financials for this Owner
Home Financials are based on the most recent Mortgage that was taken out on this home.
Original Mortgage
$137,250
Interest Rate
10.55%
Mortgage Type
Purchase Money Mortgage
Create a Home Valuation Report for This Property
The Home Valuation Report is an in-depth analysis detailing your home's value as well as a comparison with similar homes in the area
Home Values in the Area
Average Home Value in this Area
Purchase History
| Date | Buyer | Sale Price | Title Company |
|---|---|---|---|
| Canelo Jose F | -- | None Available | |
| Canelo Jose F | $310,000 | Chicago Title Insurance Comp | |
| Tran Phuong N | $215,000 | Git | |
| Tran Phuong N | $215,000 | Git | |
| Hall Cassandra | $122,000 | -- |
Source: Public Records
Mortgage History
| Date | Status | Borrower | Loan Amount |
|---|---|---|---|
| Open | Canelo Jose F | $248,000 | |
| Previous Owner | Tran Phuong N | $193,500 | |
| Previous Owner | Hall Cassandra | $137,250 |
Source: Public Records
Tax History Compared to Growth
Tax History
| Year | Tax Paid | Tax Assessment Tax Assessment Total Assessment is a certain percentage of the fair market value that is determined by local assessors to be the total taxable value of land and additions on the property. | Land | Improvement |
|---|---|---|---|---|
| 2024 | $7,973 | $34,001 | $4,687 | $29,314 |
| 2023 | $6,165 | $34,001 | $4,687 | $29,314 |
| 2022 | $6,165 | $23,428 | $4,017 | $19,411 |
| 2021 | $6,288 | $23,427 | $4,017 | $19,410 |
| 2020 | $6,182 | $23,427 | $4,017 | $19,410 |
| 2019 | $5,553 | $20,560 | $3,682 | $16,878 |
| 2018 | $5,531 | $20,560 | $3,682 | $16,878 |
| 2017 | $5,426 | $20,560 | $3,682 | $16,878 |
| 2016 | $4,755 | $17,333 | $3,347 | $13,986 |
| 2015 | $4,642 | $17,333 | $3,347 | $13,986 |
| 2014 | $4,514 | $17,333 | $3,347 | $13,986 |
| 2013 | $4,589 | $18,978 | $3,347 | $15,631 |
Source: Public Records
Map
Nearby Homes
- 291 Division St
- 1401 N 5th Ave
- 1118 N 6th Ave
- 619 N 4th Ave
- 1650 Riverwoods Dr Unit 503
- 1650 Riverwoods Dr Unit 205
- 1700 Riverwoods Dr Unit 517
- 1700 Riverwoods Dr Unit 314
- 918 Park Dr
- 1200 N 11th Ave
- 1114 N 11th Ave
- 1616 N 12th Ave
- 1202 Elsie Dr
- 1209 Helen Dr
- 613 Huron St
- 407 N 2nd Ave
- 1303 Rice St
- 1630 N 15th Ave
- 1718 N 15th Ave
- 105 N 12th Ave
- 261 Division St
- 281 Division St
- 260 Concord Dr
- 280 Concord Dr
- 251 Division St
- 250 Concord Dr
- 290 Concord Dr
- 260 Division St
- 270 Division St
- 250 Division St Unit 2
- 241 Division St
- 301 Division St
- 280 Division St
- 300 Concord Dr
- 240 Division St
- 290 Division St
- 271 Concord Dr
- 221 Division St
- 321 Division St Unit 2
- 261 Concord Dr