Estimated Value: $66,000 - $120,000
3
Beds
1
Bath
2,450
Sq Ft
$35/Sq Ft
Est. Value
About This Home
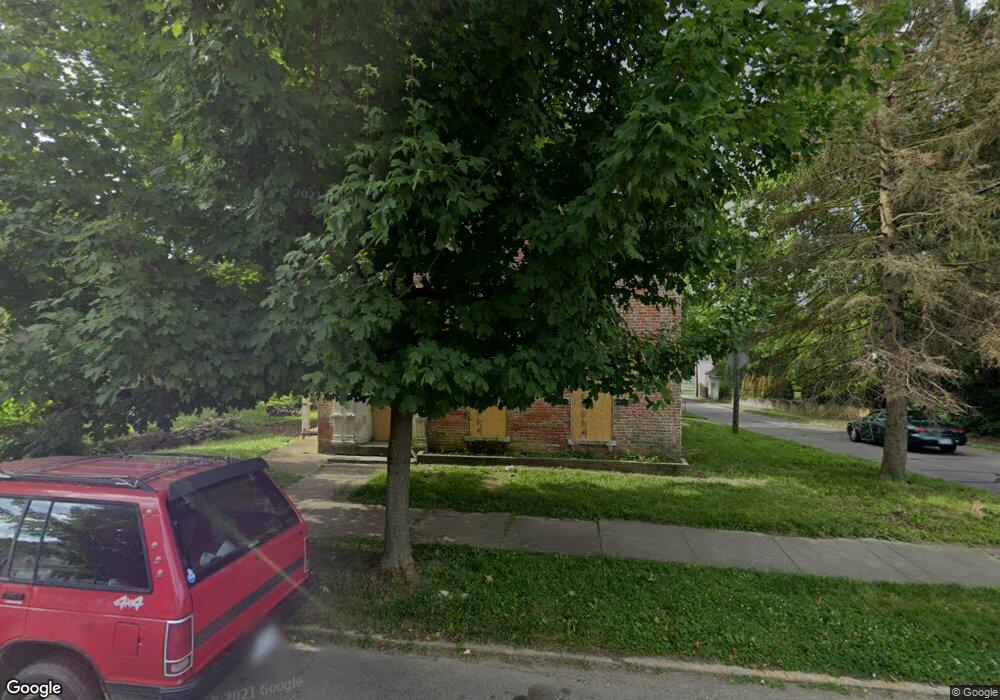
This home is located at 271 E 2nd St, Xenia, OH 45385 and is currently estimated at $86,667, approximately $35 per square foot. 271 E 2nd St is a home located in Greene County with nearby schools including Xenia High School, Summit Academy Community School for Alternative Learners - Xenia, and Legacy Christian Academy.
Ownership History
Date
Name
Owned For
Owner Type
Purchase Details
Closed on
Jun 4, 2025
Sold by
Xenia Community Improvement Corporation
Bought by
Gassaway Cameron and Gassaway Sherry
Current Estimated Value
Purchase Details
Closed on
May 23, 2024
Sold by
City Of Xenia
Bought by
Xenia Community Improvement Corporation
Purchase Details
Closed on
Jul 26, 2017
Sold by
Jette Stephen D
Bought by
Hurley Robert E and Hurley Kelli N
Purchase Details
Closed on
Apr 24, 2008
Sold by
Jette Shirley L
Bought by
Jette Stephen D
Purchase Details
Closed on
Mar 1, 2002
Sold by
Wells Fargo Bank Minnesota
Bought by
Jette Stephen D and Jette Shirley L
Purchase Details
Closed on
Sep 14, 2001
Sold by
Buford Paul N
Bought by
Wells Fargo Bank Minnesota and Option One Mtg Loan Trust 1999-C
Purchase Details
Closed on
Sep 13, 2001
Sold by
Buford Paul N and Buford Marietta L
Bought by
Wells Fargo Bank Minnesota and Norwest Bank Minnesota National Assn
Create a Home Valuation Report for This Property
The Home Valuation Report is an in-depth analysis detailing your home's value as well as a comparison with similar homes in the area
Home Values in the Area
Average Home Value in this Area
Purchase History
| Date | Buyer | Sale Price | Title Company |
|---|---|---|---|
| Gassaway Cameron | $1,000 | None Listed On Document | |
| Xenia Community Improvement Corporation | -- | None Listed On Document | |
| Hurley Robert E | -- | None Available | |
| Jette Stephen D | -- | Attorney | |
| Jette Stephen D | $31,900 | -- | |
| Wells Fargo Bank Minnesota | $50,000 | -- | |
| Wells Fargo Bank Minnesota | $50,000 | -- |
Source: Public Records
Tax History
| Year | Tax Paid | Tax Assessment Tax Assessment Total Assessment is a certain percentage of the fair market value that is determined by local assessors to be the total taxable value of land and additions on the property. | Land | Improvement |
|---|---|---|---|---|
| 2024 | $571 | $13,120 | $4,100 | $9,020 |
| 2023 | $561 | $13,120 | $4,100 | $9,020 |
| 2022 | $500 | $9,960 | $3,280 | $6,680 |
| 2021 | $3,310 | $9,960 | $3,280 | $6,680 |
| 2020 | $2,359 | $9,960 | $3,280 | $6,680 |
| 2019 | $2,139 | $25,470 | $3,520 | $21,950 |
| 2018 | $1,323 | $25,470 | $3,520 | $21,950 |
| 2017 | $1,262 | $25,470 | $3,520 | $21,950 |
| 2016 | $1,263 | $23,850 | $3,520 | $20,330 |
| 2015 | $1,266 | $23,850 | $3,520 | $20,330 |
| 2014 | $1,212 | $23,850 | $3,520 | $20,330 |
Source: Public Records
Map
Nearby Homes
Your Personal Tour Guide
Ask me questions while you tour the home.