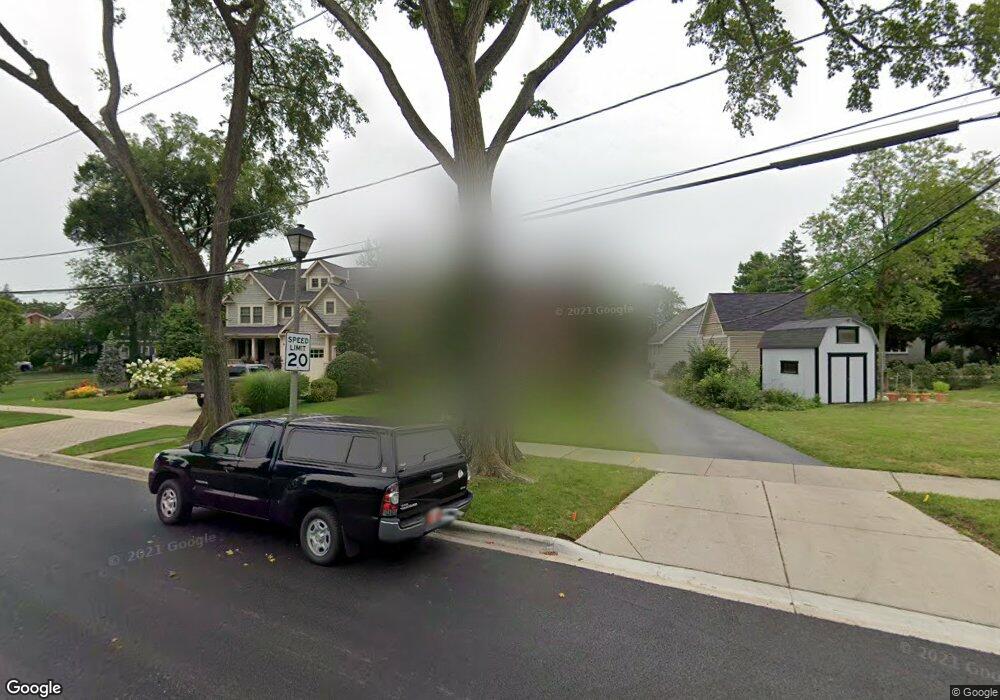
271 E South St Elmhurst, IL 60126
Estimated Value: $1,283,099 - $1,435,000
3
Beds
4
Baths
2,003
Sq Ft
$668/Sq Ft
Est. Value
About This Home
This home is located at 271 E South St, Elmhurst, IL 60126 and is currently estimated at $1,338,775, approximately $668 per square foot. 271 E South St is a home located in DuPage County with nearby schools including Ravenswood Elementary School, Ruggles Elementary School, and Edison Elementary School.
Ownership History
Date
Name
Owned For
Owner Type
Purchase Details
Closed on
Sep 10, 2014
Sold by
Dailey Sean S and Dailey Kristin L
Bought by
Dailey Sean S and The Sean S Dailey Trust
Current Estimated Value
Purchase Details
Closed on
Feb 4, 2011
Sold by
Perkins Scott W and Rozzano Patrick J
Bought by
Dailey Scan S and Dailey Kristin L
Home Financials for this Owner
Home Financials are based on the most recent Mortgage that was taken out on this home.
Original Mortgage
$484,000
Outstanding Balance
$331,705
Interest Rate
4.89%
Mortgage Type
New Conventional
Estimated Equity
$1,007,070
Purchase Details
Closed on
Feb 27, 2001
Sold by
Pasternock Nancy M
Bought by
Perkins Scott W and Rozzano Patrick J
Home Financials for this Owner
Home Financials are based on the most recent Mortgage that was taken out on this home.
Original Mortgage
$368,000
Interest Rate
6.87%
Create a Home Valuation Report for This Property
The Home Valuation Report is an in-depth analysis detailing your home's value as well as a comparison with similar homes in the area
Home Values in the Area
Average Home Value in this Area
Purchase History
| Date | Buyer | Sale Price | Title Company |
|---|---|---|---|
| Dailey Sean S | -- | None Available | |
| Dailey Scan S | $605,000 | Affinity Title Services Llc | |
| Perkins Scott W | $460,000 | Chicago Title Insurance Co |
Source: Public Records
Mortgage History
| Date | Status | Borrower | Loan Amount |
|---|---|---|---|
| Open | Dailey Scan S | $484,000 | |
| Previous Owner | Perkins Scott W | $368,000 | |
| Closed | Perkins Scott W | $46,000 |
Source: Public Records
Tax History Compared to Growth
Tax History
| Year | Tax Paid | Tax Assessment Tax Assessment Total Assessment is a certain percentage of the fair market value that is determined by local assessors to be the total taxable value of land and additions on the property. | Land | Improvement |
|---|---|---|---|---|
| 2024 | $21,726 | $368,497 | $137,067 | $231,430 |
| 2023 | $20,202 | $340,760 | $126,750 | $214,010 |
| 2022 | $19,225 | $327,570 | $121,840 | $205,730 |
| 2021 | $18,756 | $319,420 | $118,810 | $200,610 |
| 2020 | $18,038 | $312,420 | $116,210 | $196,210 |
| 2019 | $17,674 | $297,040 | $110,490 | $186,550 |
| 2018 | $15,926 | $263,070 | $104,580 | $158,490 |
| 2017 | $15,590 | $250,690 | $99,660 | $151,030 |
| 2016 | $13,619 | $236,170 | $93,890 | $142,280 |
| 2015 | $13,378 | $220,020 | $87,470 | $132,550 |
| 2014 | $13,634 | $207,920 | $70,920 | $137,000 |
| 2013 | $13,510 | $210,850 | $71,920 | $138,930 |
Source: Public Records
Map
Nearby Homes
- 224 E May St
- 562 S Poplar Ave
- 349 E Parkview Ave
- 613 S Chatham Ave
- 580 S Kearsage Ave
- 446 S Stratford Ave
- 515 S Parkview Ave
- 274 E Crescent Ave
- 550 S Hillcrest Ave
- 219 E Saint Charles Rd
- 500 S Kenilworth Ave
- 497 S Stratford Ave
- 333 E Huntington Ln
- 15 Manchester Ln
- 593 S Edgewood Ave
- 185 E Oneida Ave
- 694 S York St
- 341 E Madison St
- 28 Windsor Dr
- 211 N Hwy N
- 267 E South St
- 490 S Poplar Ave
- 488 S Poplar Ave
- 285 E South St
- 261 E South St
- 478 S Poplar Ave
- 257 E South St
- 270 E South St
- 474 S Poplar Ave
- 255 South St Unit 401
- 0 South St
- 266 E South St
- 470 S Poplar Ave
- 274 E South St
- 251 E South St
- 262 E South St
- 499 S Poplar Ave
- 468 S Poplar Ave
- 276 E South St
- 250 E South St