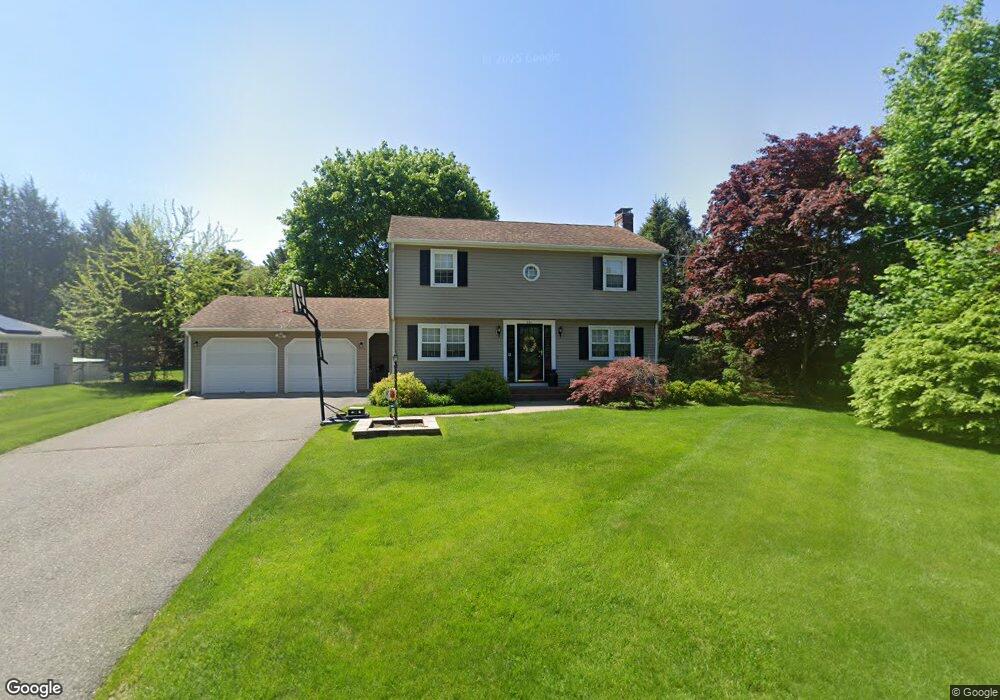
271 Elm St Agawam, MA 01001
Estimated Value: $395,000 - $425,000
4
Beds
2
Baths
1,568
Sq Ft
$264/Sq Ft
Est. Value
About This Home
This home is located at 271 Elm St, Agawam, MA 01001 and is currently estimated at $414,256, approximately $264 per square foot. 271 Elm St is a home located in Hampden County with nearby schools including Agawam Junior High School and Agawam High School.
Ownership History
Date
Name
Owned For
Owner Type
Purchase Details
Closed on
Aug 30, 2018
Sold by
Vecchiarelli Peter C
Bought by
Vecchiarelli Dianne L
Current Estimated Value
Purchase Details
Closed on
Nov 28, 2011
Sold by
Watson Robert and Watson Elaine F
Bought by
Vecchiarelli Peter C and Vecchiarelli Dianne F
Home Financials for this Owner
Home Financials are based on the most recent Mortgage that was taken out on this home.
Original Mortgage
$216,000
Interest Rate
4.12%
Mortgage Type
Purchase Money Mortgage
Create a Home Valuation Report for This Property
The Home Valuation Report is an in-depth analysis detailing your home's value as well as a comparison with similar homes in the area
Home Values in the Area
Average Home Value in this Area
Purchase History
| Date | Buyer | Sale Price | Title Company |
|---|---|---|---|
| Vecchiarelli Dianne L | -- | -- | |
| Vecchiarelli Peter C | $240,000 | -- |
Source: Public Records
Mortgage History
| Date | Status | Borrower | Loan Amount |
|---|---|---|---|
| Previous Owner | Vecchiarelli Peter C | $216,000 |
Source: Public Records
Tax History Compared to Growth
Tax History
| Year | Tax Paid | Tax Assessment Tax Assessment Total Assessment is a certain percentage of the fair market value that is determined by local assessors to be the total taxable value of land and additions on the property. | Land | Improvement |
|---|---|---|---|---|
| 2025 | $5,108 | $348,900 | $112,700 | $236,200 |
| 2024 | $4,961 | $341,200 | $112,700 | $228,500 |
| 2023 | $4,657 | $295,100 | $106,800 | $188,300 |
| 2022 | $4,462 | $277,000 | $106,800 | $170,200 |
| 2021 | $4,141 | $246,500 | $87,700 | $158,800 |
| 2020 | $4,051 | $240,700 | $86,200 | $154,500 |
| 2019 | $3,913 | $235,000 | $84,400 | $150,600 |
| 2018 | $3,633 | $218,700 | $79,900 | $138,800 |
| 2017 | $3,459 | $212,100 | $79,900 | $132,200 |
| 2016 | $3,307 | $204,400 | $79,900 | $124,500 |
| 2015 | $3,139 | $199,400 | $79,900 | $119,500 |
Source: Public Records
Map
Nearby Homes
- 0 Silver St
- 4H Mapleviewlane Unit 4H
- 35 Birch Hill Rd
- 7 Castle Hill Rd Unit G
- 6 Castle Hill Rd Unit E
- 13 Castle Hills Rd Unit B
- 15 B Castle Hills Rd Unit B
- 73 Silver Lake Dr
- 190 Mill St
- 795 Main St
- 47 Butternut Dr
- 36 Cottonwood Ln
- 441 Silver St
- 712 Cooper St
- 68 Peros Dr
- 52 Peros Dr
- 198 Beekman Dr
- 354 Rowley St
- 83 Harvey Johnson Dr
- 23 Peros Dr