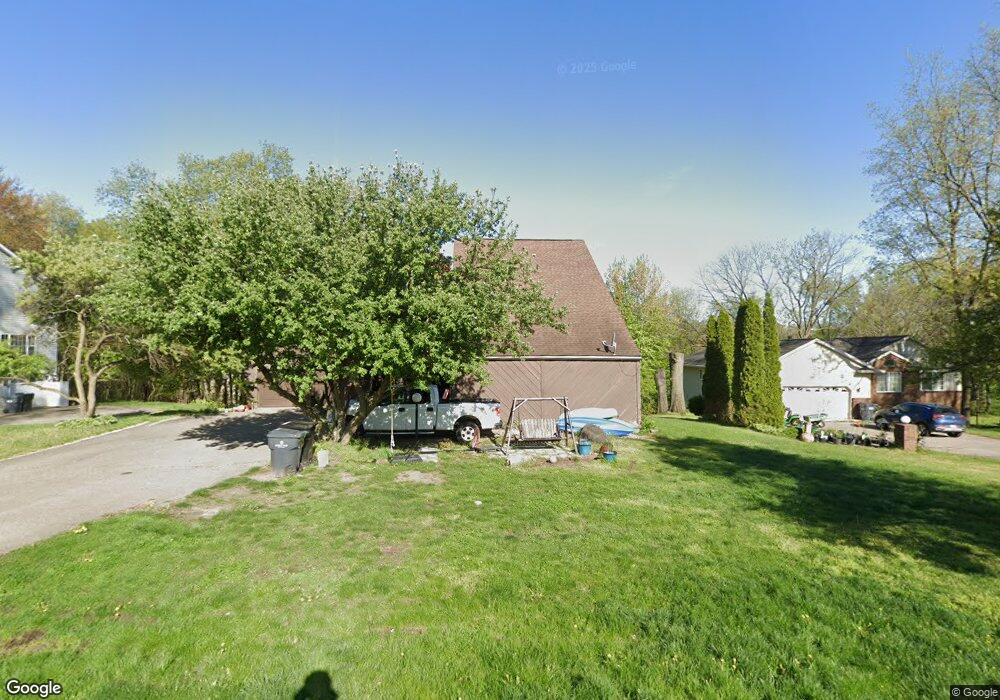
271 Fairway Ct Plainwell, MI 49080
Estimated Value: $262,000 - $369,000
2
Beds
3
Baths
2,320
Sq Ft
$133/Sq Ft
Est. Value
About This Home
This home is located at 271 Fairway Ct, Plainwell, MI 49080 and is currently estimated at $308,612, approximately $133 per square foot. 271 Fairway Ct is a home located in Allegan County with nearby schools including Plainwell High School.
Ownership History
Date
Name
Owned For
Owner Type
Purchase Details
Closed on
Sep 19, 2014
Sold by
Howard Dustin and Howard Melissa
Bought by
Howard Dustin and Howard Melissa
Current Estimated Value
Home Financials for this Owner
Home Financials are based on the most recent Mortgage that was taken out on this home.
Original Mortgage
$94,100
Outstanding Balance
$71,542
Interest Rate
4.11%
Mortgage Type
New Conventional
Estimated Equity
$237,070
Purchase Details
Closed on
Feb 8, 2001
Sold by
Dzialowski Michael and Dzialowski Yvonne
Bought by
Dzalowski Michael
Purchase Details
Closed on
Nov 28, 2000
Sold by
Dzialowski Michael
Bought by
Lovejoy Lorie
Purchase Details
Closed on
Nov 9, 2000
Sold by
Dzialowski Michael
Bought by
Lovejoy Lorie
Purchase Details
Closed on
Sep 22, 2000
Sold by
Dzialowski Michael and Dzialowski Yvonne
Bought by
Dzialowski Michael
Purchase Details
Closed on
Jun 30, 1997
Sold by
Le Jian Bin
Bought by
Dzialdwski Michael and Dzialdwski Yvonne
Purchase Details
Closed on
Sep 30, 1994
Sold by
Cross Shirley M
Bought by
Jian Bin Li and Jing Chang
Create a Home Valuation Report for This Property
The Home Valuation Report is an in-depth analysis detailing your home's value as well as a comparison with similar homes in the area
Home Values in the Area
Average Home Value in this Area
Purchase History
| Date | Buyer | Sale Price | Title Company |
|---|---|---|---|
| Howard Dustin | -- | None Available | |
| Howard Dustin | $104,600 | Devon | |
| Dzalowski Michael | -- | -- | |
| Lovejoy Lorie | $122,000 | -- | |
| Lovejoy Lorie | $122,000 | -- | |
| Lovejoy Lorie | $122,000 | -- | |
| Dzialowski Michael | -- | -- | |
| Dzialdwski Michael | $119,500 | -- | |
| Dzialdwski Michael | $119,500 | -- | |
| Jian Bin Li | $95,500 | -- |
Source: Public Records
Mortgage History
| Date | Status | Borrower | Loan Amount |
|---|---|---|---|
| Open | Howard Dustin | $94,100 |
Source: Public Records
Tax History
| Year | Tax Paid | Tax Assessment Tax Assessment Total Assessment is a certain percentage of the fair market value that is determined by local assessors to be the total taxable value of land and additions on the property. | Land | Improvement |
|---|---|---|---|---|
| 2025 | $2,712 | $125,900 | $16,200 | $109,700 |
| 2024 | $2,473 | $120,000 | $14,200 | $105,800 |
| 2023 | $2,513 | $112,000 | $13,800 | $98,200 |
| 2022 | $2,473 | $98,300 | $10,100 | $88,200 |
| 2020 | $2,310 | $69,100 | $8,400 | $60,700 |
| 2019 | $0 | $65,500 | $8,400 | $57,100 |
| 2018 | $0 | $62,500 | $8,400 | $54,100 |
| 2017 | $0 | $62,300 | $8,400 | $53,900 |
| 2016 | $0 | $61,300 | $8,400 | $52,900 |
| 2015 | -- | $61,300 | $8,400 | $52,900 |
| 2014 | -- | $72,300 | $8,400 | $63,900 |
| 2013 | -- | $68,100 | $8,400 | $59,700 |
Source: Public Records
Map
Nearby Homes
- 272 Fairway Ct
- 247 Deer Run Blvd
- 282 Doster Rd
- VL Doster Road Lot#wp001
- 337 Horseshoe Ct
- 412 Midlakes Blvd
- 134 Doster Rd
- 15313 Doster Rd
- 24 Heron Ct
- 361 4th St
- 3127 Elk Antler Ave Unit 2
- 3041 Elk Antler Ave
- 10466 N Riverview Dr
- 3166 Elk Antler Ave Unit 8
- 3165 Elk Antler Ave Unit 1
- 12344 Warner Rd
- 2824 E B Ave
- 694 Pierce Rd
- VL Pierce Rd
- 667 Pierce Rd
- 273 Fairway Ct
- 269 Fairway Ct
- 281 Fairway Ct
- 267 Fairway Ct
- 275 Fairway Ct
- 275 Fairway Ct Unit B
- 263 Fairway Ct
- 270 Fairway Ct
- 274 Fairway Ct
- 279 Fairway Ct
- 279 Fairway Ct Unit A
- 274 Fairway Ct Unit B
- 274 Fairway Ct Unit A
- 274 Fairway Ct
- 266 Fairway Ct
- 276 Fairway Ct
- 259 Fairway Ct
- 262 Fairway Ct
- 281 Fairway Ct Unit A
- 281 Fairway Ct Unit B
Your Personal Tour Guide
Ask me questions while you tour the home.