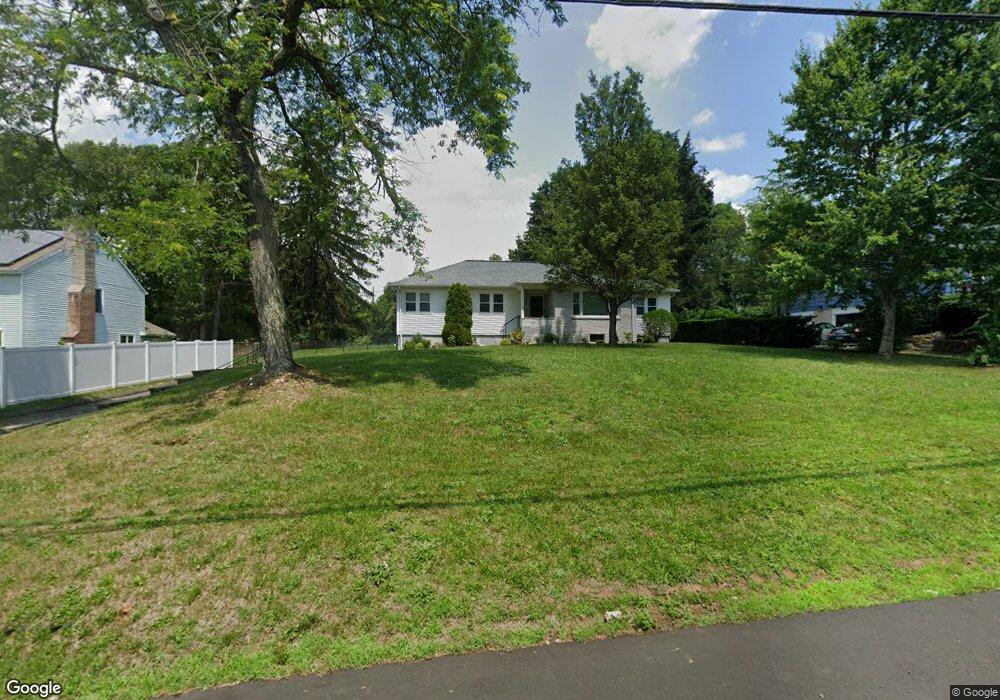
271 Four Rod Rd Hamden, CT 06514
Estimated Value: $358,000 - $396,000
3
Beds
2
Baths
1,266
Sq Ft
$297/Sq Ft
Est. Value
About This Home
This home is located at 271 Four Rod Rd, Hamden, CT 06514 and is currently estimated at $375,441, approximately $296 per square foot. 271 Four Rod Rd is a home located in New Haven County with nearby schools including Hamden Middle School, Hamden High School, and Alphabet Academy - Hamden North Campus.
Ownership History
Date
Name
Owned For
Owner Type
Purchase Details
Closed on
Feb 24, 2023
Sold by
Cirillo Michael J
Bought by
Cirillo Laura
Current Estimated Value
Purchase Details
Closed on
Nov 12, 2020
Sold by
367 Edgewood Assoc Llc
Bought by
Cirillo Michael J
Home Financials for this Owner
Home Financials are based on the most recent Mortgage that was taken out on this home.
Original Mortgage
$164,000
Interest Rate
2.8%
Mortgage Type
Balloon
Purchase Details
Closed on
Feb 2, 2005
Sold by
Jamoralin Renee
Bought by
Cirillo Michael
Purchase Details
Closed on
Aug 12, 1998
Sold by
Emerson David I
Bought by
Jamoralin Renee
Purchase Details
Closed on
Jun 26, 1997
Sold by
Piccirillo Joseph and Watson Diane
Bought by
Emerson David I
Create a Home Valuation Report for This Property
The Home Valuation Report is an in-depth analysis detailing your home's value as well as a comparison with similar homes in the area
Home Values in the Area
Average Home Value in this Area
Purchase History
| Date | Buyer | Sale Price | Title Company |
|---|---|---|---|
| Cirillo Laura | -- | None Available | |
| Cirillo Michael J | -- | None Available | |
| Cirillo Michael | $216,000 | -- | |
| Jamoralin Renee | $120,000 | -- | |
| Emerson David I | $124,500 | -- |
Source: Public Records
Mortgage History
| Date | Status | Borrower | Loan Amount |
|---|---|---|---|
| Previous Owner | Cirillo Michael J | $164,000 | |
| Previous Owner | Emerson David I | $163,000 | |
| Previous Owner | Emerson David I | $210,500 | |
| Previous Owner | Emerson David I | $21,400 |
Source: Public Records
Tax History
| Year | Tax Paid | Tax Assessment Tax Assessment Total Assessment is a certain percentage of the fair market value that is determined by local assessors to be the total taxable value of land and additions on the property. | Land | Improvement |
|---|---|---|---|---|
| 2025 | $11,970 | $230,720 | $58,100 | $172,620 |
| 2024 | $7,248 | $130,340 | $40,670 | $89,670 |
| 2023 | $7,349 | $130,340 | $40,670 | $89,670 |
| 2022 | $7,231 | $130,340 | $40,670 | $89,670 |
| 2021 | $6,835 | $130,340 | $40,670 | $89,670 |
| 2020 | $7,001 | $134,680 | $70,910 | $63,770 |
| 2019 | $6,580 | $134,680 | $70,910 | $63,770 |
| 2018 | $6,459 | $134,680 | $70,910 | $63,770 |
| 2017 | $6,096 | $134,680 | $70,910 | $63,770 |
| 2016 | $6,109 | $134,680 | $70,910 | $63,770 |
| 2015 | $6,317 | $154,560 | $78,820 | $75,740 |
| 2014 | $6,172 | $154,560 | $78,820 | $75,740 |
Source: Public Records
Map
Nearby Homes
- 33 Sky View Cir
- 225 Hill St
- 5 Shepard Hill Rd
- 900 Mix Ave Unit 69
- 900 Mix Ave Unit 123
- 36 Norman Rd
- 175 Mill Pond Rd Unit 106
- 34 Canterbury Rd
- 4 Raccio Park Rd
- 172 Towne House Rd
- 541 Hill St
- 150 Towne House Rd Unit 150
- 136 Shepard Ave Unit 136
- 37 Towne House Rd
- 32 Towne House Rd Unit 32
- 114 Colony St
- 707 Mix Ave Unit 38
- 1380 Paradise Ave
- 1020 Shepard Ave
- 660 Sherman Ave
Your Personal Tour Guide
Ask me questions while you tour the home.