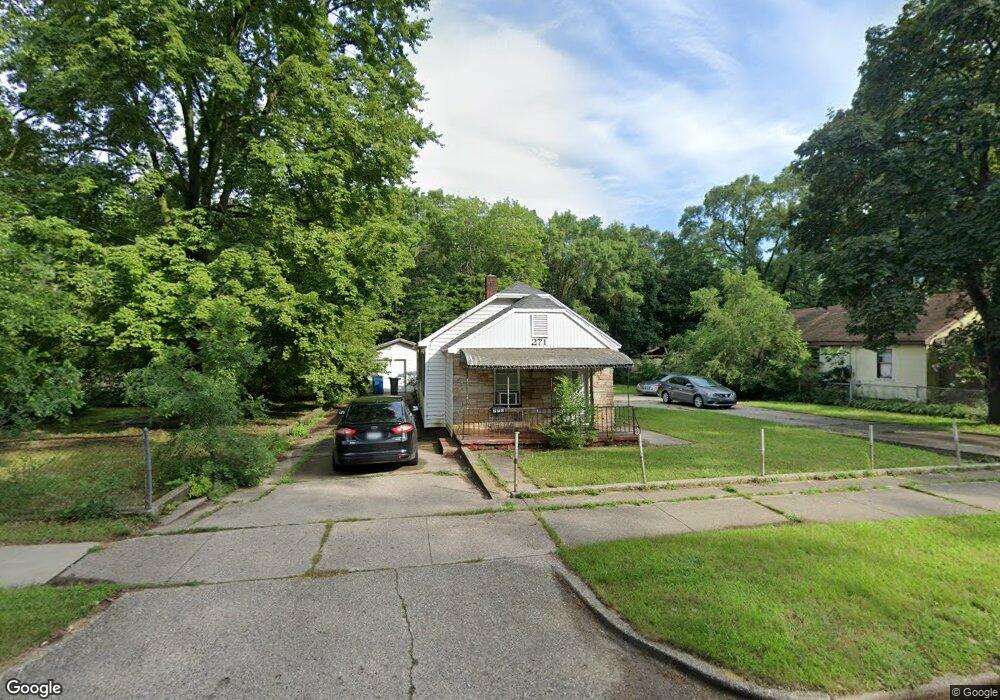
271 Harrison Blvd Muskegon, MI 49444
Estimated Value: $73,000 - $109,293
2
Beds
1
Bath
845
Sq Ft
$104/Sq Ft
Est. Value
About This Home
This home is located at 271 Harrison Blvd, Muskegon, MI 49444 and is currently estimated at $88,073, approximately $104 per square foot. 271 Harrison Blvd is a home located in Muskegon County with nearby schools including Edgewood Elementary Academy, Dr. Martin Luther King Academy, and Muskegon Heights Academy.
Ownership History
Date
Name
Owned For
Owner Type
Purchase Details
Closed on
Oct 1, 2019
Sold by
Muskegon County Treasurer S
Bought by
Watt Mcarthur
Current Estimated Value
Purchase Details
Closed on
Jun 1, 2016
Sold by
Cook Marjorie
Bought by
Watt Statnely
Purchase Details
Closed on
May 9, 2016
Sold by
Watt Mcarthur
Bought by
Cook Marjorie
Purchase Details
Closed on
Oct 21, 2013
Sold by
Muskegon County Treasurers Office For Th
Bought by
Watt Mcarthur
Purchase Details
Closed on
Jul 29, 2013
Sold by
Stonecrest Income & Opportunity Fund I L
Bought by
Jones Juliet M
Purchase Details
Closed on
Aug 10, 2010
Sold by
Central Mortgage Company
Bought by
Federal National Mortgage Association
Purchase Details
Closed on
Aug 6, 2010
Sold by
Campbell Brad L
Bought by
Central Mortgage Company
Purchase Details
Closed on
Jan 11, 2008
Sold by
Mueller Susan Lee
Bought by
Campbell Brad L
Purchase Details
Closed on
Aug 11, 2005
Sold by
Campbell Brad L
Bought by
Mueller Susan Lee
Create a Home Valuation Report for This Property
The Home Valuation Report is an in-depth analysis detailing your home's value as well as a comparison with similar homes in the area
Home Values in the Area
Average Home Value in this Area
Purchase History
| Date | Buyer | Sale Price | Title Company |
|---|---|---|---|
| Watt Mcarthur | $2,400 | None Available | |
| Watt Statnely | -- | None Available | |
| Cook Marjorie | -- | None Available | |
| Watt Mcarthur | $300 | None Available | |
| Jones Juliet M | $101 | None Available | |
| Federal National Mortgage Association | -- | Rei | |
| Central Mortgage Company | $53,688 | None Available | |
| Campbell Brad L | -- | None Available | |
| Mueller Susan Lee | -- | -- |
Source: Public Records
Tax History Compared to Growth
Tax History
| Year | Tax Paid | Tax Assessment Tax Assessment Total Assessment is a certain percentage of the fair market value that is determined by local assessors to be the total taxable value of land and additions on the property. | Land | Improvement |
|---|---|---|---|---|
| 2025 | $728 | $40,500 | $0 | $0 |
| 2024 | $540 | $20,600 | $0 | $0 |
| 2023 | $589 | $16,700 | $0 | $0 |
| 2022 | $804 | $11,900 | $0 | $0 |
| 2021 | $783 | $10,900 | $0 | $0 |
| 2020 | $775 | $10,200 | $0 | $0 |
| 2019 | $588 | $9,900 | $0 | $0 |
| 2018 | $574 | $8,000 | $0 | $0 |
| 2017 | $533 | $7,400 | $0 | $0 |
| 2016 | $338 | $7,200 | $0 | $0 |
| 2015 | -- | $6,900 | $0 | $0 |
| 2014 | -- | $7,600 | $0 | $0 |
| 2013 | -- | $7,500 | $0 | $0 |
Source: Public Records
Map
Nearby Homes
- 371 E Columbia Ave
- 157 Harrison Blvd
- 2818 Riordan St
- 3437 S Getty St
- 3033 Morton Ave
- 224 E Lincoln Ave
- 48 Harrison Blvd
- 957-983 E Broadway Ave
- 2545 S Getty St
- 2615 Wood St
- 2833 Hoyt St
- 2816 Leahy St
- 307 E Sherman Blvd
- 2529 Riordan St
- 2626 Leahy St
- 56 E Lincoln Ave
- 2525 Reynolds St
- 2504 Ray St
- 32 Crescent Ave
- 2701 Huizenga St Unit 66
- 267 Harrison Blvd
- 259 Harrison Blvd
- 283 Harrison Blvd
- 257 Harrison Blvd
- 256 Harrison Blvd
- 270 Harrison Blvd
- 450 Collins Ave
- 249 Harrison Blvd
- 2837 Jarman St
- 276 Harrison Blvd
- 2839 Jarman St
- 2833 Jarman St
- 2843 Jarman St
- 250 Harrison Blvd
- 454 Collins Ave
- 2907 Roy Ave
- 246 Harrison Blvd
- 460 Collins Ave
- 235 Harrison Blvd
- 241 Harrison Blvd