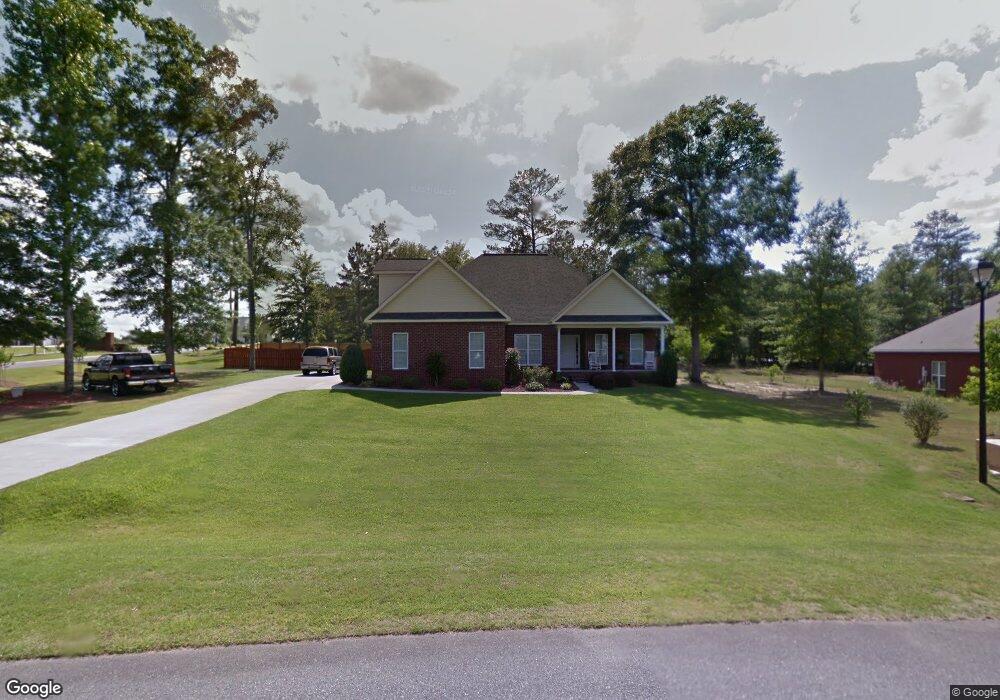
271 Hidden Creek Cir Lizella, GA 31052
Estimated Value: $319,000 - $337,000
3
Beds
2
Baths
2,279
Sq Ft
$144/Sq Ft
Est. Value
About This Home
This home is located at 271 Hidden Creek Cir, Lizella, GA 31052 and is currently estimated at $328,221, approximately $144 per square foot. 271 Hidden Creek Cir is a home located in Bibb County with nearby schools including Skyview Elementary School, Rutland Middle School, and Rutland High School.
Ownership History
Date
Name
Owned For
Owner Type
Purchase Details
Closed on
May 21, 2010
Sold by
Russell Reginald
Bought by
Russell Reginald and Russell Cynthia
Current Estimated Value
Home Financials for this Owner
Home Financials are based on the most recent Mortgage that was taken out on this home.
Original Mortgage
$164,326
Outstanding Balance
$103,589
Interest Rate
3.87%
Mortgage Type
FHA
Estimated Equity
$224,632
Purchase Details
Closed on
May 11, 2010
Sold by
Citizens Bank & Trust Company
Bought by
Russell Reginald
Home Financials for this Owner
Home Financials are based on the most recent Mortgage that was taken out on this home.
Original Mortgage
$164,326
Outstanding Balance
$103,589
Interest Rate
3.87%
Mortgage Type
FHA
Estimated Equity
$224,632
Purchase Details
Closed on
Aug 22, 2008
Sold by
Bright Star Construction Inc
Bought by
Citziens Bank & Trust Co
Purchase Details
Closed on
Jan 3, 2008
Sold by
Bright Star Construction Inc
Bought by
Emerson Willard
Purchase Details
Closed on
Mar 16, 2006
Bought by
Bright Star Const Llc
Create a Home Valuation Report for This Property
The Home Valuation Report is an in-depth analysis detailing your home's value as well as a comparison with similar homes in the area
Home Values in the Area
Average Home Value in this Area
Purchase History
| Date | Buyer | Sale Price | Title Company |
|---|---|---|---|
| Russell Reginald | -- | None Available | |
| Russell Reginald | $170,000 | None Available | |
| Citziens Bank & Trust Co | -- | -- | |
| Emerson Willard | -- | None Available | |
| Bright Star Const Llc | $266,600 | -- |
Source: Public Records
Mortgage History
| Date | Status | Borrower | Loan Amount |
|---|---|---|---|
| Open | Russell Reginald | $164,326 |
Source: Public Records
Tax History Compared to Growth
Tax History
| Year | Tax Paid | Tax Assessment Tax Assessment Total Assessment is a certain percentage of the fair market value that is determined by local assessors to be the total taxable value of land and additions on the property. | Land | Improvement |
|---|---|---|---|---|
| 2024 | $2,955 | $116,350 | $12,000 | $104,350 |
| 2023 | $2,955 | $116,350 | $12,000 | $104,350 |
| 2022 | $3,464 | $100,060 | $10,350 | $89,710 |
| 2021 | $3,342 | $87,946 | $9,450 | $78,496 |
| 2020 | $3,153 | $81,218 | $9,450 | $71,768 |
| 2019 | $3,220 | $82,263 | $9,000 | $73,263 |
| 2018 | $4,595 | $73,644 | $9,000 | $64,644 |
| 2017 | $2,436 | $65,024 | $9,000 | $56,024 |
| 2016 | $2,250 | $65,024 | $9,000 | $56,024 |
| 2015 | $3,184 | $65,024 | $9,000 | $56,024 |
| 2014 | $3,189 | $65,024 | $9,000 | $56,024 |
Source: Public Records
Map
Nearby Homes
- 132 Hidden Creek Cir
- 169 Hidden Creek Cir
- 169 Doublegate Dr
- 173 Doublegate Dr
- 177 Doublegate Dr
- 181 Doublegate Dr
- 6408 Michael Dr
- 312 Woodmont Ct
- 6219 Clayts Cir
- 148 Marcar Rd
- 218 Jason Way
- 7241 Winterberry Cir
- 7253 Winterberry Cir
- 7209 Winterberry Cir
- 7216 Winterberry Cir
- 7220 Winterberry Cir
- 7212 Winterberry Cir
- 6100 Clayts Cir
- 5845 Mount Pleasant Church Rd
- 275 Hidden Creek Cir
- 272 Hidden Creek Cir
- 277 Hidden Creek Cir
- 268 Hidden Creek Cir
- 267 Hidden Creek Cir
- 274 Hidden Creek Cir
- 6211 Rogers Rd
- 260 Hidden Creek Cir
- 200 Hidden Creek Blvd
- 265 Hidden Creek Cir
- 101 Wood Creek Trail
- 6077 Rogers Rd
- 6233 Rogers Rd
- 261 Hidden Creek Cir
- 100 Hidden Creek Cir
- 258 Hidden Creek Cir
- 316 Wood Point Ct
- 0 Woodpoint Ct Unit 7525676
- 0 Woodpoint Ct Unit 3150350
- 318 Wood Point Ct