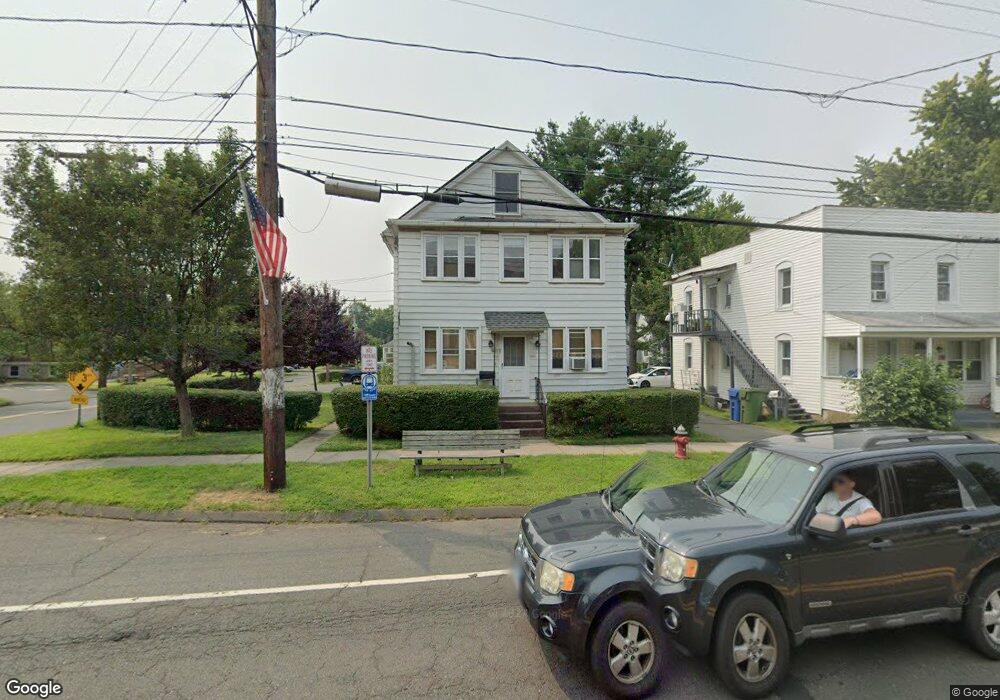
271 Main St Cromwell, CT 06416
Estimated Value: $290,000 - $335,600
5
Beds
2
Baths
2,053
Sq Ft
$156/Sq Ft
Est. Value
About This Home
This home is located at 271 Main St, Cromwell, CT 06416 and is currently estimated at $319,650, approximately $155 per square foot. 271 Main St is a home located in Middlesex County with nearby schools including Edna C. Stevens School, Woodside Intermediate School, and Cromwell Middle School.
Ownership History
Date
Name
Owned For
Owner Type
Purchase Details
Closed on
Jun 12, 2020
Sold by
Hastings Michael
Bought by
Hastings Patrick and Hastings Michael
Current Estimated Value
Purchase Details
Closed on
Jan 16, 2015
Sold by
Laplante Phyllis M
Bought by
Hastings Cindy M and Hastings Michael J
Home Financials for this Owner
Home Financials are based on the most recent Mortgage that was taken out on this home.
Original Mortgage
$179,742
Interest Rate
3.92%
Mortgage Type
New Conventional
Purchase Details
Closed on
Jan 28, 2010
Sold by
Oberschall Alex R
Bought by
Jurman Tani and Oberschall Alex R
Purchase Details
Closed on
Dec 23, 2009
Sold by
Laplante Phyllis M
Bought by
Oberschall Alex R
Purchase Details
Closed on
Feb 23, 2001
Sold by
Monarca Josephine Est and Monarca
Bought by
Laplante Richard O and Laplante Phyllis M
Create a Home Valuation Report for This Property
The Home Valuation Report is an in-depth analysis detailing your home's value as well as a comparison with similar homes in the area
Home Values in the Area
Average Home Value in this Area
Purchase History
| Date | Buyer | Sale Price | Title Company |
|---|---|---|---|
| Hastings Patrick | -- | None Available | |
| Hastings Patrick | -- | None Available | |
| Hastings Cindy M | $174,000 | -- | |
| Hastings Cindy M | $174,000 | -- | |
| Jurman Tani | -- | -- | |
| Jurman Tani | -- | -- | |
| Oberschall Alex R | $162,000 | -- | |
| Oberschall Alex R | $162,000 | -- | |
| Laplante Richard O | $27,500 | -- | |
| Laplante Richard O | $192,500 | -- | |
| Laplante Richard O | $27,500 | -- |
Source: Public Records
Mortgage History
| Date | Status | Borrower | Loan Amount |
|---|---|---|---|
| Previous Owner | Laplante Richard O | $179,742 |
Source: Public Records
Tax History Compared to Growth
Tax History
| Year | Tax Paid | Tax Assessment Tax Assessment Total Assessment is a certain percentage of the fair market value that is determined by local assessors to be the total taxable value of land and additions on the property. | Land | Improvement |
|---|---|---|---|---|
| 2025 | $5,108 | $165,900 | $55,720 | $110,180 |
| 2024 | $4,989 | $165,900 | $55,720 | $110,180 |
| 2023 | $4,879 | $165,900 | $55,720 | $110,180 |
| 2022 | $5,130 | $121,450 | $53,340 | $68,110 |
| 2021 | $4,048 | $121,450 | $53,340 | $68,110 |
| 2020 | $3,987 | $121,450 | $53,340 | $68,110 |
| 2019 | $3,987 | $121,450 | $53,340 | $68,110 |
| 2018 | $3,987 | $121,450 | $53,340 | $68,110 |
| 2017 | $4,123 | $121,520 | $46,170 | $75,350 |
| 2016 | $4,087 | $121,520 | $46,170 | $75,350 |
| 2015 | $3,813 | $121,520 | $46,170 | $75,350 |
| 2014 | $4,044 | $121,520 | $46,170 | $75,350 |
Source: Public Records
Map
Nearby Homes