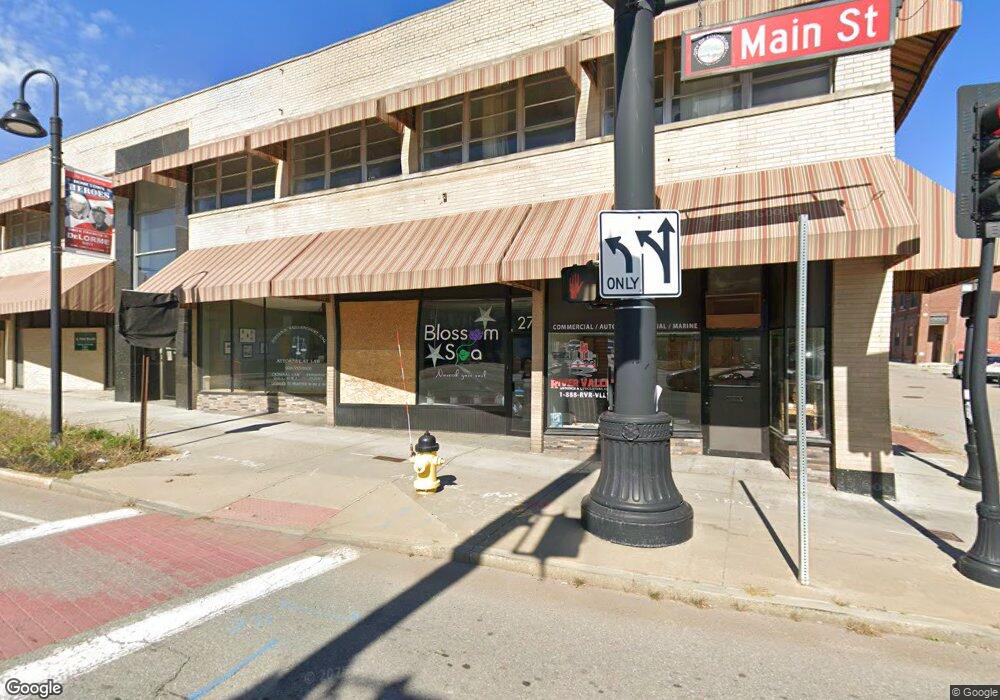
271 Main St Fitchburg, MA 01420
Estimated Value: $128,511
--
Bed
--
Bath
1,274
Sq Ft
$101/Sq Ft
Est. Value
About This Home
This home is located at 271 Main St, Fitchburg, MA 01420 and is currently estimated at $128,511, approximately $100 per square foot. 271 Main St is a home located in Worcester County with nearby schools including South Street Elementary School, Crocker Elementary School, and Reingold Elementary School.
Ownership History
Date
Name
Owned For
Owner Type
Purchase Details
Closed on
Jan 11, 2018
Sold by
Erban Christian
Bought by
Chartier Alexandra
Current Estimated Value
Home Financials for this Owner
Home Financials are based on the most recent Mortgage that was taken out on this home.
Original Mortgage
$52,900
Interest Rate
3.9%
Mortgage Type
New Conventional
Purchase Details
Closed on
Aug 23, 1991
Sold by
Arslanian Ronald L
Bought by
Erban Christian
Home Financials for this Owner
Home Financials are based on the most recent Mortgage that was taken out on this home.
Original Mortgage
$60,000
Interest Rate
9.55%
Mortgage Type
Commercial
Purchase Details
Closed on
Oct 11, 1988
Sold by
Napshaw Company
Bought by
Mcfarlane K
Create a Home Valuation Report for This Property
The Home Valuation Report is an in-depth analysis detailing your home's value as well as a comparison with similar homes in the area
Home Values in the Area
Average Home Value in this Area
Purchase History
| Date | Buyer | Sale Price | Title Company |
|---|---|---|---|
| Chartier Alexandra | $59,900 | -- | |
| Erban Christian | $60,000 | -- | |
| Erban Christian | $60,000 | -- | |
| Mcfarlane K | $57,400 | -- |
Source: Public Records
Mortgage History
| Date | Status | Borrower | Loan Amount |
|---|---|---|---|
| Closed | Chartier Alexandra | $52,900 | |
| Previous Owner | Mcfarlane K | $60,000 | |
| Previous Owner | Mcfarlane K | $12,500 |
Source: Public Records
Tax History Compared to Growth
Tax History
| Year | Tax Paid | Tax Assessment Tax Assessment Total Assessment is a certain percentage of the fair market value that is determined by local assessors to be the total taxable value of land and additions on the property. | Land | Improvement |
|---|---|---|---|---|
| 2025 | $8 | $56,000 | $0 | $56,000 |
| 2024 | $816 | $55,100 | $0 | $55,100 |
| 2023 | $1,003 | $62,600 | $0 | $62,600 |
| 2022 | $1,034 | $58,700 | $0 | $58,700 |
| 2021 | $1,115 | $58,600 | $0 | $58,600 |
| 2020 | $1,131 | $57,400 | $0 | $57,400 |
| 2019 | $941 | $42,600 | $0 | $42,600 |
| 2018 | $1,019 | $41,800 | $0 | $41,800 |
| 2017 | $963 | $36,800 | $0 | $36,800 |
| 2016 | $973 | $36,800 | $0 | $36,800 |
| 2015 | $1,281 | $48,600 | $0 | $48,600 |
| 2014 | $1,279 | $48,600 | $0 | $48,600 |
Source: Public Records
Map
Nearby Homes
- 275 Main St
- 283 Main St
- 275 Main St Unit 104
- 8 Day St
- 8 Day St Unit 1
- 281 Main St
- 281 Main St Unit 1-8
- 300 Main Street - 2nd Floor
- 300 Main Street - 3rd Floor
- 325 Main St Unit 327
- 325 Main St Unit 1
- 325 Main St Unit 3
- 325 Main St Unit 2
- 325 Main St Unit 4
- 298-300 Main St
- 331 Main St
- 300 Main St
- 298 Main St Unit 3
- 298 Main St
- 333 Main