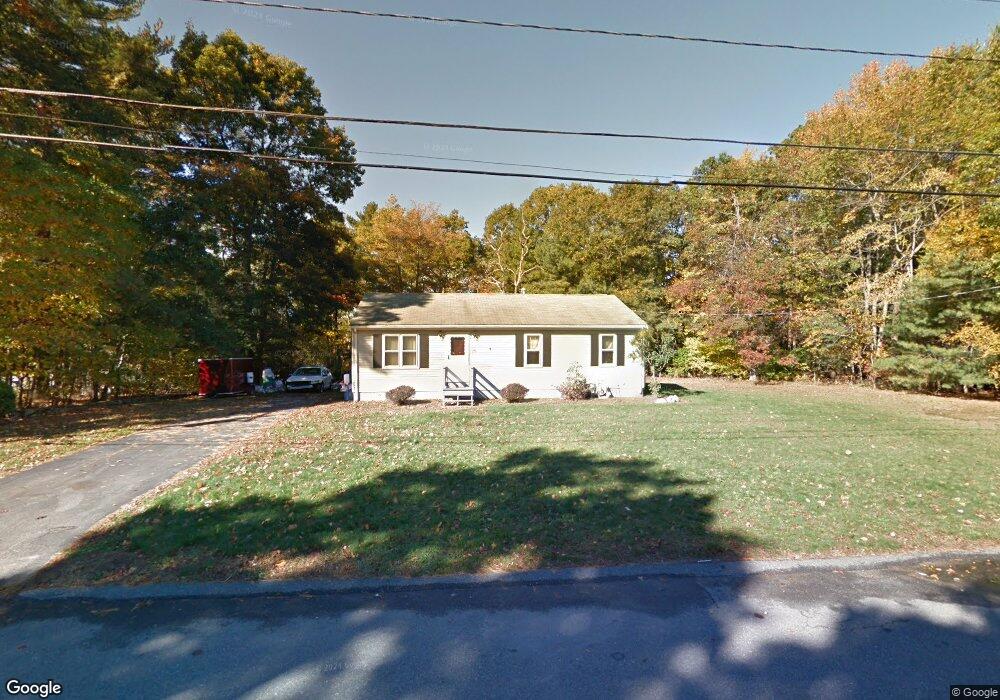
271 Mockingbird Way East Taunton, MA 02718
East Taunton NeighborhoodEstimated Value: $480,635 - $523,000
3
Beds
2
Baths
1,092
Sq Ft
$461/Sq Ft
Est. Value
About This Home
This home is located at 271 Mockingbird Way, East Taunton, MA 02718 and is currently estimated at $503,409, approximately $460 per square foot. 271 Mockingbird Way is a home located in Bristol County with nearby schools including East Taunton Elementary School, Joseph H. Martin, and Taunton High School.
Ownership History
Date
Name
Owned For
Owner Type
Purchase Details
Closed on
Jul 1, 2016
Sold by
Lavornia Dena M
Bought by
Mcdonnell Nikki M
Current Estimated Value
Home Financials for this Owner
Home Financials are based on the most recent Mortgage that was taken out on this home.
Original Mortgage
$230,743
Outstanding Balance
$182,218
Interest Rate
3.25%
Mortgage Type
FHA
Estimated Equity
$321,191
Purchase Details
Closed on
Oct 21, 2010
Sold by
Lavornia Anthony Joseph and Lavornia Dena M
Bought by
Lavornia Dena M
Purchase Details
Closed on
Feb 17, 2004
Sold by
Lapointe Eduardina
Bought by
Mcdonald Dena M
Purchase Details
Closed on
Jan 27, 1994
Sold by
Andrade Ronald J and Andrade Norma J
Bought by
Lapointe Eduardina
Home Financials for this Owner
Home Financials are based on the most recent Mortgage that was taken out on this home.
Original Mortgage
$55,000
Interest Rate
7.11%
Mortgage Type
Purchase Money Mortgage
Create a Home Valuation Report for This Property
The Home Valuation Report is an in-depth analysis detailing your home's value as well as a comparison with similar homes in the area
Home Values in the Area
Average Home Value in this Area
Purchase History
| Date | Buyer | Sale Price | Title Company |
|---|---|---|---|
| Mcdonnell Nikki M | $235,000 | -- | |
| Lavornia Dena M | -- | -- | |
| Mcdonald Dena M | -- | -- | |
| Lapointe Eduardina | $114,000 | -- |
Source: Public Records
Mortgage History
| Date | Status | Borrower | Loan Amount |
|---|---|---|---|
| Open | Mcdonnell Nikki M | $230,743 | |
| Previous Owner | Lapointe Eduardina | $55,000 |
Source: Public Records
Tax History Compared to Growth
Tax History
| Year | Tax Paid | Tax Assessment Tax Assessment Total Assessment is a certain percentage of the fair market value that is determined by local assessors to be the total taxable value of land and additions on the property. | Land | Improvement |
|---|---|---|---|---|
| 2025 | $4,486 | $410,100 | $139,800 | $270,300 |
| 2024 | $4,301 | $384,400 | $139,800 | $244,600 |
| 2023 | $4,151 | $344,500 | $133,400 | $211,100 |
| 2022 | $4,094 | $310,600 | $121,800 | $188,800 |
| 2021 | $3,891 | $274,000 | $110,700 | $163,300 |
| 2020 | $3,881 | $261,200 | $110,700 | $150,500 |
| 2019 | $2,113 | $250,100 | $110,700 | $139,400 |
| 2018 | $3,677 | $233,900 | $111,800 | $122,100 |
| 2017 | $1,916 | $225,000 | $106,000 | $119,000 |
| 2016 | $3,390 | $216,200 | $102,900 | $113,300 |
| 2015 | $3,287 | $219,000 | $104,300 | $114,700 |
| 2014 | $3,154 | $215,900 | $104,300 | $111,600 |
Source: Public Records
Map
Nearby Homes
- 220 Erin Rd
- 203 Bluejay Ln
- 81 Tania Dr
- 28 B Staples St Unit B
- 68 Metacomet Ave
- 550 Middleboro Ave
- 96 Old Colony Ave Unit 264
- 649 Middleboro Ave
- 96 Old Colony Ave Unit 318
- 96 Old Colony Ave Unit 268
- 96 Old Colony Ave Unit 202
- 218R Hart St Unit B
- 120 South St E
- 32 Kendall Ct
- 17 Maries Way
- 210 Linsay Dr
- 31 Bruno's Way Unit A
- 3 Karena Dr Unit 8
- 170 Hart St Unit B
- 138 Pine Tree Ln
- 285 Mockingbird Way
- 15 Kingfisher Way
- 257 Mockingbird Way
- 299 Mockingbird Way
- 256 Mockingbird Way
- 20 Kingfisher Way
- 35 Kingfisher Way
- 245 Mockingbird Way
- 36 Kingfisher Way
- 79 Bluejay Ln
- 79 Bluejay Ln Unit 1
- 311 Mockingbird Way
- 65 Bluejay Ln
- 45 Kingfisher Way
- 231 Mockingbird Way
- 321 Mockingbird Way
- 91 Bluejay Ln
- 230 Erin Rd
- 50 Kingfisher Way
- 115 Bluejay Ln