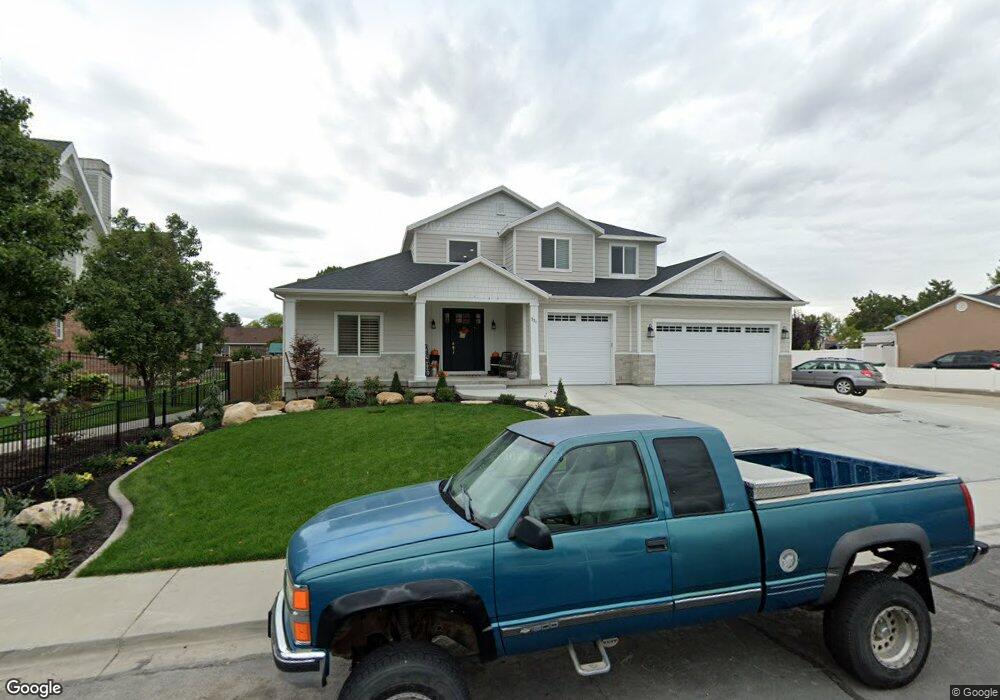
271 N 650 E Orem, UT 84097
Cascade NeighborhoodEstimated Value: $1,006,000 - $1,155,533
4
Beds
4
Baths
2,963
Sq Ft
$365/Sq Ft
Est. Value
About This Home
This home is located at 271 N 650 E, Orem, UT 84097 and is currently estimated at $1,080,767, approximately $364 per square foot. 271 N 650 E is a home with nearby schools including Cascade Elementary School, Canyon View Junior High School, and Orem High School.
Ownership History
Date
Name
Owned For
Owner Type
Purchase Details
Closed on
Mar 1, 2022
Sold by
Joseph Finch Daniel and Joseph Cynthia
Bought by
Dnc Holdings Llc
Current Estimated Value
Purchase Details
Closed on
Jan 14, 2022
Sold by
Joseph Finch Daniel and Joseph Cynthia
Bought by
Dnc Holdings Llc
Purchase Details
Closed on
Oct 28, 2021
Sold by
Finch Daniel J and Finch Cynthia G
Bought by
Dnc Holdings Llc
Purchase Details
Closed on
Aug 10, 2021
Sold by
Finch Daniel J and Finch Cynthia G
Bought by
Finch Daniel Joseph and Finch Cynthia
Home Financials for this Owner
Home Financials are based on the most recent Mortgage that was taken out on this home.
Original Mortgage
$260,000
Interest Rate
2.9%
Mortgage Type
New Conventional
Purchase Details
Closed on
Apr 19, 2019
Sold by
Finch Daniel J and Finch Cynthia G
Bought by
Dnc Holdings Llc
Create a Home Valuation Report for This Property
The Home Valuation Report is an in-depth analysis detailing your home's value as well as a comparison with similar homes in the area
Home Values in the Area
Average Home Value in this Area
Purchase History
| Date | Buyer | Sale Price | Title Company |
|---|---|---|---|
| Dnc Holdings Llc | -- | None Listed On Document | |
| Dnc Holdings Llc | -- | None Listed On Document | |
| Dnc Holdings Llc | -- | None Listed On Document | |
| Finch Daniel Joseph | -- | Meriidan Title Co | |
| Dnc Holdings Llc | -- | None Available |
Source: Public Records
Mortgage History
| Date | Status | Borrower | Loan Amount |
|---|---|---|---|
| Previous Owner | Finch Daniel Joseph | $260,000 |
Source: Public Records
Tax History
| Year | Tax Paid | Tax Assessment Tax Assessment Total Assessment is a certain percentage of the fair market value that is determined by local assessors to be the total taxable value of land and additions on the property. | Land | Improvement |
|---|---|---|---|---|
| 2025 | $3,983 | $573,650 | -- | -- |
| 2024 | $3,983 | $487,080 | $0 | $0 |
| 2023 | $3,618 | $475,530 | $0 | $0 |
| 2022 | $3,235 | $411,895 | $0 | $0 |
| 2021 | $1,437 | $152,400 | $152,400 | $0 |
| 2020 | $1,169 | $121,900 | $121,900 | $0 |
| 2019 | $1,054 | $114,300 | $114,300 | $0 |
| 2018 | $1,067 | $110,500 | $110,500 | $0 |
| 2017 | $982 | $99,100 | $0 | $0 |
| 2016 | $762 | $70,900 | $0 | $0 |
| 2015 | $745 | $65,500 | $0 | $0 |
| 2014 | $740 | $64,800 | $0 | $0 |
Source: Public Records
Map
Nearby Homes
Your Personal Tour Guide
Ask me questions while you tour the home.