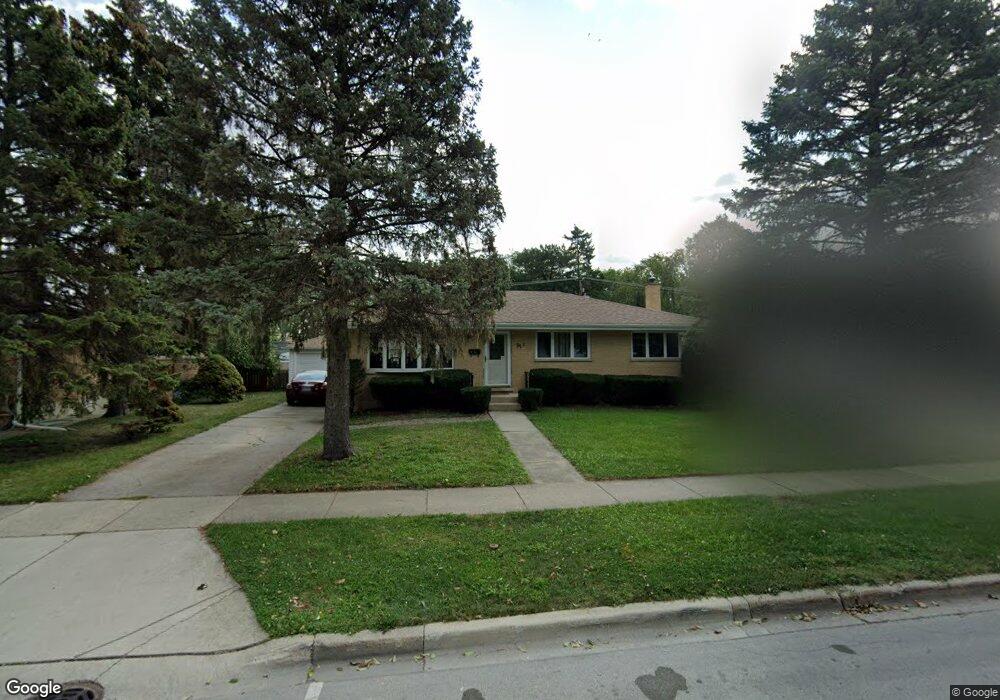
271 N Mill Rd Wood Dale, IL 60191
Estimated Value: $336,193 - $398,000
3
Beds
2
Baths
1,166
Sq Ft
$321/Sq Ft
Est. Value
About This Home
This home is located at 271 N Mill Rd, Wood Dale, IL 60191 and is currently estimated at $374,798, approximately $321 per square foot. 271 N Mill Rd is a home located in DuPage County with nearby schools including Raymond Benson Primary School, Elmer H Franzen Intermediate School, and F.E. Peacock Middle School.
Ownership History
Date
Name
Owned For
Owner Type
Purchase Details
Closed on
Oct 26, 2018
Sold by
Barr Michael D
Bought by
Barr Antonina
Current Estimated Value
Home Financials for this Owner
Home Financials are based on the most recent Mortgage that was taken out on this home.
Original Mortgage
$250,800
Outstanding Balance
$222,327
Interest Rate
5.21%
Mortgage Type
New Conventional
Estimated Equity
$152,471
Purchase Details
Closed on
Oct 10, 2006
Sold by
Shafer Laura H
Bought by
Barr Michael D and Barr Antonina
Home Financials for this Owner
Home Financials are based on the most recent Mortgage that was taken out on this home.
Original Mortgage
$309,000
Interest Rate
6.5%
Mortgage Type
Purchase Money Mortgage
Purchase Details
Closed on
Sep 28, 1996
Sold by
Shafer Kenneth and Shafer Laura H
Bought by
Shafer Kenneth and Shafer Laura H
Create a Home Valuation Report for This Property
The Home Valuation Report is an in-depth analysis detailing your home's value as well as a comparison with similar homes in the area
Home Values in the Area
Average Home Value in this Area
Purchase History
| Date | Buyer | Sale Price | Title Company |
|---|---|---|---|
| Barr Antonina | -- | Attorney | |
| Barr Michael D | $317,000 | First American Title Ins Co | |
| Shafer Kenneth | -- | -- |
Source: Public Records
Mortgage History
| Date | Status | Borrower | Loan Amount |
|---|---|---|---|
| Open | Barr Antonina | $250,800 | |
| Closed | Barr Michael D | $309,000 |
Source: Public Records
Tax History Compared to Growth
Tax History
| Year | Tax Paid | Tax Assessment Tax Assessment Total Assessment is a certain percentage of the fair market value that is determined by local assessors to be the total taxable value of land and additions on the property. | Land | Improvement |
|---|---|---|---|---|
| 2024 | $7,230 | $105,734 | $48,385 | $57,349 |
| 2023 | $6,893 | $97,200 | $44,480 | $52,720 |
| 2022 | $6,501 | $90,900 | $41,370 | $49,530 |
| 2021 | $6,198 | $87,070 | $39,630 | $47,440 |
| 2020 | $5,822 | $83,400 | $37,960 | $45,440 |
| 2019 | $5,668 | $80,190 | $36,500 | $43,690 |
| 2018 | $5,710 | $80,190 | $36,500 | $43,690 |
| 2017 | $5,509 | $76,640 | $34,880 | $41,760 |
| 2016 | $5,310 | $70,760 | $32,200 | $38,560 |
| 2015 | $5,142 | $65,370 | $29,750 | $35,620 |
| 2014 | $5,059 | $62,380 | $28,870 | $33,510 |
| 2013 | $4,962 | $63,650 | $29,460 | $34,190 |
Source: Public Records
Map
Nearby Homes
- 418 Bonnie Brae Ave
- 272 Prospect Ave
- 445 Broker Ave
- 500 S Princeton Ave
- 449 Broker Ave
- 261 Montgomery Ln Unit 18
- 543 Sarah Dr
- 243 Washington Square Unit 16
- 206 E George St
- 249 N Addison Rd
- 330 S Maple St
- 105 E Irving Park Rd
- 443 S Lombard Rd
- 100 S Walnut St
- 711 E Greenview Rd
- 335 Arlington Rd
- 600 W Bloomingdale Rd
- 421 N Elm St
- 465 W Dominion Dr Unit 909
- 465 W Dominion Dr Unit 1302