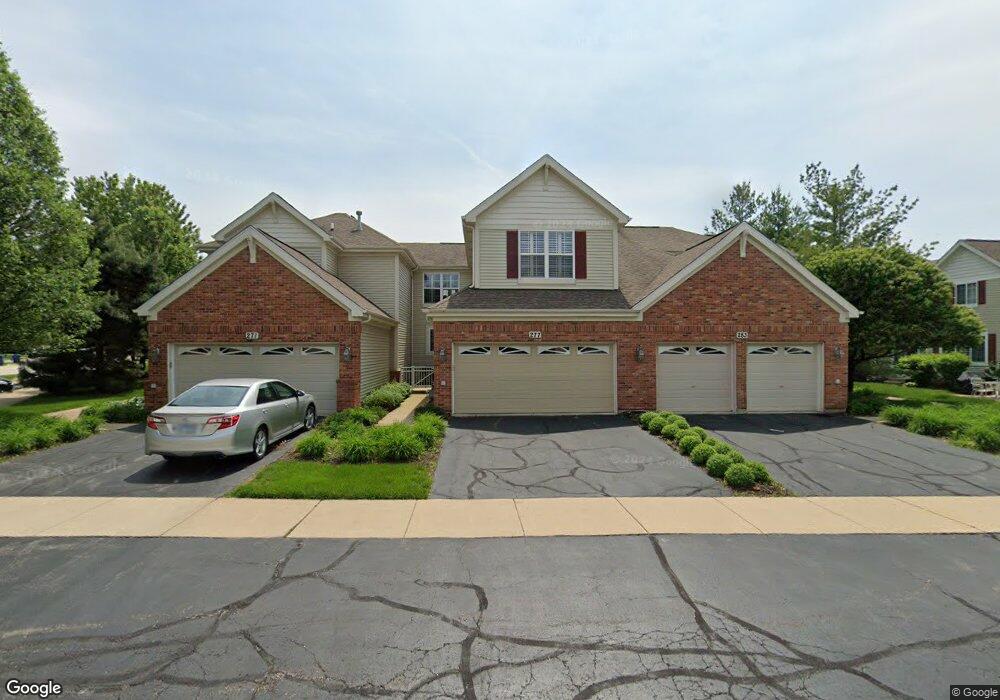
271 Remington Dr Unit 18-1 Saint Charles, IL 60175
Harvest Hills NeighborhoodEstimated Value: $391,000 - $409,000
2
Beds
3
Baths
1,645
Sq Ft
$243/Sq Ft
Est. Value
About This Home
This home is located at 271 Remington Dr Unit 18-1, Saint Charles, IL 60175 and is currently estimated at $399,376, approximately $242 per square foot. 271 Remington Dr Unit 18-1 is a home located in Kane County with nearby schools including Ferson Creek Elementary School, Thompson Middle School, and St Charles East High School.
Ownership History
Date
Name
Owned For
Owner Type
Purchase Details
Closed on
Aug 30, 2021
Sold by
Tate Kathleen M
Bought by
Brummet Wendy L and Wendy L Brummet Living Trust
Current Estimated Value
Purchase Details
Closed on
Jun 4, 2011
Sold by
Graber Carl W and Graber Candace E
Bought by
Tate Kathleen M
Home Financials for this Owner
Home Financials are based on the most recent Mortgage that was taken out on this home.
Original Mortgage
$196,950
Interest Rate
4.5%
Mortgage Type
FHA
Purchase Details
Closed on
Nov 20, 2007
Sold by
Remington Glen Llc
Bought by
Graber Carl W and Graber Candace E
Home Financials for this Owner
Home Financials are based on the most recent Mortgage that was taken out on this home.
Original Mortgage
$189,900
Interest Rate
6.47%
Mortgage Type
Purchase Money Mortgage
Create a Home Valuation Report for This Property
The Home Valuation Report is an in-depth analysis detailing your home's value as well as a comparison with similar homes in the area
Home Values in the Area
Average Home Value in this Area
Purchase History
| Date | Buyer | Sale Price | Title Company |
|---|---|---|---|
| Brummet Wendy L | $317,000 | Attorney | |
| Tate Kathleen M | $210,000 | Chicago Title Insurance Co | |
| Graber Carl W | $290,000 | Chicago Title Insurance Co |
Source: Public Records
Mortgage History
| Date | Status | Borrower | Loan Amount |
|---|---|---|---|
| Previous Owner | Tate Kathleen M | $196,950 | |
| Previous Owner | Graber Carl W | $189,900 |
Source: Public Records
Tax History Compared to Growth
Tax History
| Year | Tax Paid | Tax Assessment Tax Assessment Total Assessment is a certain percentage of the fair market value that is determined by local assessors to be the total taxable value of land and additions on the property. | Land | Improvement |
|---|---|---|---|---|
| 2024 | $7,943 | $115,005 | $24,206 | $90,799 |
| 2023 | $7,598 | $102,931 | $21,665 | $81,266 |
| 2022 | $7,519 | $99,127 | $23,980 | $75,147 |
| 2021 | $6,642 | $87,443 | $22,858 | $64,585 |
| 2020 | $6,569 | $85,813 | $22,432 | $63,381 |
| 2019 | $6,447 | $84,114 | $21,988 | $62,126 |
| 2018 | $6,423 | $83,431 | $21,151 | $62,280 |
| 2017 | $6,249 | $80,579 | $20,428 | $60,151 |
| 2016 | $6,189 | $73,747 | $19,711 | $54,036 |
| 2015 | -- | $69,951 | $19,498 | $50,453 |
| 2014 | -- | $69,562 | $19,498 | $50,064 |
| 2013 | -- | $71,727 | $19,693 | $52,034 |
Source: Public Records
Map
Nearby Homes
- 242 Remington Dr
- 3534 Matisse Dr
- 3108 Saint Michel Ln
- 3042 Saint Michel Ln
- 3350 Saint Michel Ct
- 239 Grand Ridge Rd
- 243 Valley View Dr Unit 2
- 264 Valley View Dr Unit 2
- 810 Thornwood Dr
- 423 Horizon Dr W
- 38W691 W Mary Ln
- 535 Red Sky Dr
- 3006 Langston Cir
- 125 Fairview Dr Unit 7
- 4N220 Thornly Rd
- 39W278 Baert Ln
- 26 S 13th St
- 328 S 14th St Unit 3
- 43W321 Creekside Ct
- 1010 Walnut St
- 271 Remington Dr
- 277 Remington Dr
- 283 Remington Dr
- 229 Remington Dr
- 223 Remington Dr
- 236 Remington Dr
- 217 Remington Dr
- 248 Remington Dr
- 224 Remington Dr
- 282 Birch Ln
- 282 Birch Ln Unit 2
- 288 Birch Ln
- 276 Birch Ln
- 276 Birch Ln Unit 19-3
- 230 Remington Dr
- 270 Birch Ln Unit 4
- 211 Remington Dr
- 266 Remington Dr Unit 8-2
- 266 Remington Dr