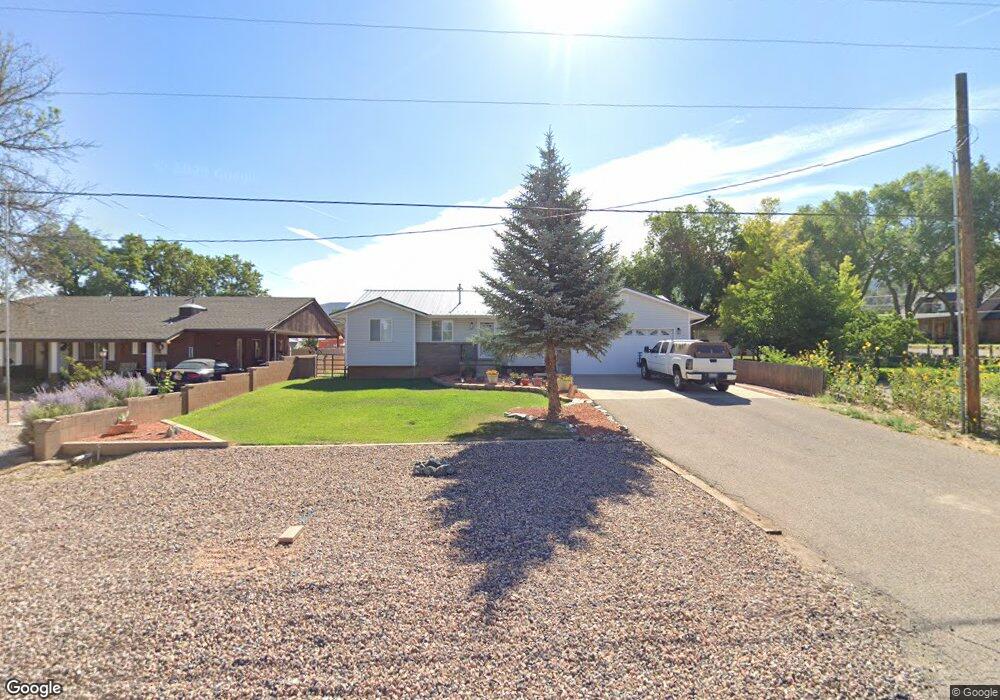
271 S 100 E Parowan, UT 84761
Estimated Value: $366,000 - $442,000
4
Beds
3
Baths
2,434
Sq Ft
$168/Sq Ft
Est. Value
About This Home
This home is located at 271 S 100 E, Parowan, UT 84761 and is currently estimated at $409,482, approximately $168 per square foot. 271 S 100 E is a home located in Iron County with nearby schools including Parowan School, Parowan High School, and Cedar City High School.
Ownership History
Date
Name
Owned For
Owner Type
Purchase Details
Closed on
Oct 7, 2020
Sold by
Huber Ryan W and Huber Kylynne R
Bought by
Mcconville David and Mcconville Rosalind
Current Estimated Value
Home Financials for this Owner
Home Financials are based on the most recent Mortgage that was taken out on this home.
Original Mortgage
$50,000
Outstanding Balance
$44,472
Interest Rate
2.9%
Mortgage Type
New Conventional
Estimated Equity
$365,010
Purchase Details
Closed on
Aug 12, 2015
Sold by
Orton Benson Patrick Scott and Orton Benson Alana
Bought by
Huber Ryan W and Huber Kylynne R
Home Financials for this Owner
Home Financials are based on the most recent Mortgage that was taken out on this home.
Original Mortgage
$166,887
Interest Rate
4.05%
Mortgage Type
New Conventional
Create a Home Valuation Report for This Property
The Home Valuation Report is an in-depth analysis detailing your home's value as well as a comparison with similar homes in the area
Home Values in the Area
Average Home Value in this Area
Purchase History
| Date | Buyer | Sale Price | Title Company |
|---|---|---|---|
| Mcconville David | -- | Southern Ut Ttl Co Of Cedar | |
| Huber Ryan W | -- | Cedar Land Title Inc |
Source: Public Records
Mortgage History
| Date | Status | Borrower | Loan Amount |
|---|---|---|---|
| Open | Mcconville David | $50,000 | |
| Previous Owner | Huber Ryan W | $166,887 |
Source: Public Records
Tax History
| Year | Tax Paid | Tax Assessment Tax Assessment Total Assessment is a certain percentage of the fair market value that is determined by local assessors to be the total taxable value of land and additions on the property. | Land | Improvement |
|---|---|---|---|---|
| 2025 | $1,737 | $215,650 | $49,327 | $166,323 |
| 2023 | $1,673 | $228,170 | $49,325 | $178,845 |
| 2022 | $1,856 | $193,880 | $44,840 | $149,040 |
| 2021 | $533 | $138,420 | $28,025 | $110,395 |
| 2020 | $1,289 | $118,960 | $21,990 | $96,970 |
| 2019 | $1,216 | $107,055 | $21,990 | $85,065 |
| 2018 | $1,209 | $104,190 | $19,125 | $85,065 |
| 2017 | $1,108 | $93,135 | $19,125 | $74,010 |
| 2016 | $1,085 | $86,405 | $19,125 | $67,280 |
| 2015 | $1,087 | $81,725 | $0 | $0 |
| 2014 | $1,139 | $81,725 | $0 | $0 |
Source: Public Records
Map
Nearby Homes
- 161 E 200 South St
- 290 E 200 S
- 180 S 300 E Unit E2
- 25 S 200 E
- 1 Parowan Foothills
- 140 W 300 S
- 150 W 300 S
- 495 125 S
- 0 Parowan Foothills
- 1 ACFT Water Right: 75-251 Unit 1915 Priority
- 10 ACFT Water Right: 75-2258 Unit 1917 Priority
- 220 N 300 E
- 56 S 500 W
- 24 S 500 W
- 267 N 300 W
- 755 W 130 N
- 1.73 AF Water Right ~ #75-1
- 0 Lot 2 Blk 8 Plat C Unit 108795
- 6.81 ACFT Water Right: 75-251 Unit 1915 Priority
- 1.51
Your Personal Tour Guide
Ask me questions while you tour the home.