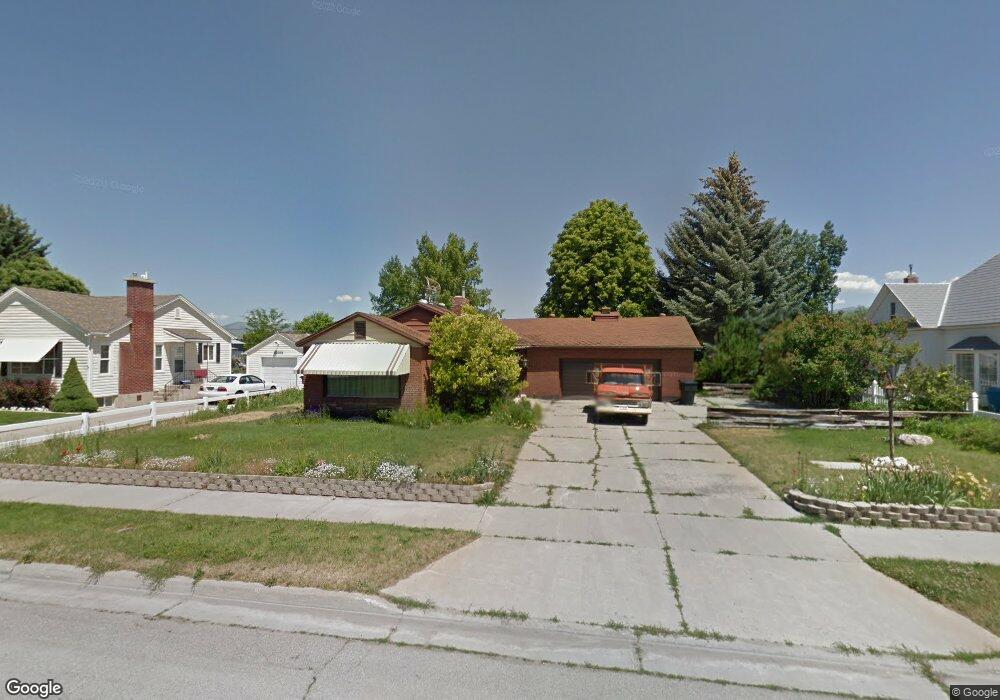
271 S 3rd E Preston, ID 83263
Estimated Value: $347,000 - $414,000
4
Beds
2
Baths
2,704
Sq Ft
$139/Sq Ft
Est. Value
About This Home
This home is located at 271 S 3rd E, Preston, ID 83263 and is currently estimated at $376,277, approximately $139 per square foot. 271 S 3rd E is a home located in Franklin County with nearby schools including Pioneer Elementary School, Oakwood Elementary School, and Preston Junior High School.
Ownership History
Date
Name
Owned For
Owner Type
Purchase Details
Closed on
Oct 16, 2020
Sold by
Chatterton Heidi
Bought by
Chatterton Erik B
Current Estimated Value
Home Financials for this Owner
Home Financials are based on the most recent Mortgage that was taken out on this home.
Original Mortgage
$220,008
Outstanding Balance
$194,880
Interest Rate
2.8%
Mortgage Type
FHA
Estimated Equity
$181,397
Purchase Details
Closed on
May 5, 2015
Sold by
Olson Jimmie
Bought by
Bishop Nathan I and Bishop Rachael L
Home Financials for this Owner
Home Financials are based on the most recent Mortgage that was taken out on this home.
Original Mortgage
$10,000
Interest Rate
3.63%
Mortgage Type
Credit Line Revolving
Create a Home Valuation Report for This Property
The Home Valuation Report is an in-depth analysis detailing your home's value as well as a comparison with similar homes in the area
Home Values in the Area
Average Home Value in this Area
Purchase History
| Date | Buyer | Sale Price | Title Company |
|---|---|---|---|
| Chatterton Erik B | -- | Northern Title | |
| Chatterton Erik B | -- | Northern Title | |
| Bishop Nathan I | -- | First American Title Co |
Source: Public Records
Mortgage History
| Date | Status | Borrower | Loan Amount |
|---|---|---|---|
| Open | Chatterton Erik B | $220,008 | |
| Closed | Chatterton Erik B | $220,008 | |
| Previous Owner | Bishop Nathan I | $10,000 | |
| Previous Owner | Bishop Nathan I | $87,400 |
Source: Public Records
Tax History
| Year | Tax Paid | Tax Assessment Tax Assessment Total Assessment is a certain percentage of the fair market value that is determined by local assessors to be the total taxable value of land and additions on the property. | Land | Improvement |
|---|---|---|---|---|
| 2025 | $1,543 | $333,355 | $60,000 | $273,355 |
| 2024 | $1,640 | $336,503 | $60,000 | $276,503 |
| 2023 | $1,518 | $336,503 | $60,000 | $276,503 |
| 2022 | $2,066 | $329,048 | $49,397 | $279,651 |
| 2021 | $1,478 | $243,382 | $49,397 | $193,985 |
| 2020 | $1,441 | $218,965 | $0 | $0 |
| 2019 | $1,365 | $180,966 | $49,397 | $131,569 |
| 2018 | $1,315 | $165,839 | $32,478 | $133,361 |
| 2017 | $1,248 | $165,839 | $32,478 | $133,361 |
| 2016 | $1,149 | $141,248 | $32,478 | $108,770 |
| 2015 | $1,126 | $141,248 | $32,478 | $108,770 |
| 2014 | $6,108 | $141,248 | $32,478 | $108,770 |
| 2013 | -- | $141,250 | $32,480 | $108,770 |
Source: Public Records
Map
Nearby Homes
Your Personal Tour Guide
Ask me questions while you tour the home.