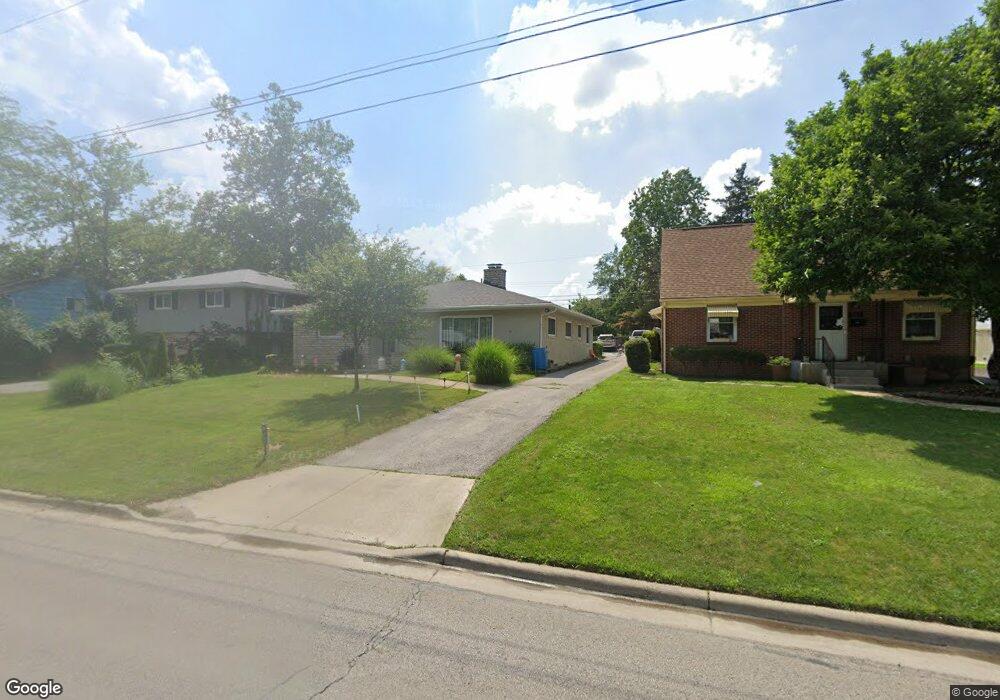
271 S James Rd Columbus, OH 43213
Eastmoor NeighborhoodEstimated Value: $239,000 - $341,321
3
Beds
2
Baths
1,622
Sq Ft
$174/Sq Ft
Est. Value
About This Home
This home is located at 271 S James Rd, Columbus, OH 43213 and is currently estimated at $282,580, approximately $174 per square foot. 271 S James Rd is a home located in Franklin County with nearby schools including Fairmoor Elementary School, Johnson Park Middle School, and Walnut Ridge High School.
Ownership History
Date
Name
Owned For
Owner Type
Purchase Details
Closed on
Nov 22, 2021
Sold by
Theodore Penn Jr and Theodore Lisa Leah
Bought by
Penn Theodore and Penn Leah Lisa
Current Estimated Value
Home Financials for this Owner
Home Financials are based on the most recent Mortgage that was taken out on this home.
Original Mortgage
$126,000
Interest Rate
3.09%
Mortgage Type
New Conventional
Purchase Details
Closed on
Aug 25, 1998
Sold by
Grayfer Lev and Grayfer Polina
Bought by
Penn Theodore
Home Financials for this Owner
Home Financials are based on the most recent Mortgage that was taken out on this home.
Original Mortgage
$80,750
Interest Rate
7.03%
Purchase Details
Closed on
Apr 28, 1992
Create a Home Valuation Report for This Property
The Home Valuation Report is an in-depth analysis detailing your home's value as well as a comparison with similar homes in the area
Home Values in the Area
Average Home Value in this Area
Purchase History
| Date | Buyer | Sale Price | Title Company |
|---|---|---|---|
| Penn Theodore | -- | Ask Services | |
| Penn Theodore | $85,000 | Foundation Title Agency Inc | |
| -- | $60,400 | -- |
Source: Public Records
Mortgage History
| Date | Status | Borrower | Loan Amount |
|---|---|---|---|
| Previous Owner | Penn Theodore | $126,000 | |
| Previous Owner | Penn Theodore | $80,750 |
Source: Public Records
Tax History Compared to Growth
Tax History
| Year | Tax Paid | Tax Assessment Tax Assessment Total Assessment is a certain percentage of the fair market value that is determined by local assessors to be the total taxable value of land and additions on the property. | Land | Improvement |
|---|---|---|---|---|
| 2024 | $4,332 | $96,530 | $41,510 | $55,020 |
| 2023 | $4,277 | $96,530 | $41,510 | $55,020 |
| 2022 | $2,257 | $43,510 | $10,080 | $33,430 |
| 2021 | $2,261 | $43,510 | $10,080 | $33,430 |
| 2020 | $2,264 | $43,510 | $10,080 | $33,430 |
| 2019 | $2,113 | $34,830 | $8,090 | $26,740 |
| 2018 | $2,111 | $34,830 | $8,090 | $26,740 |
| 2017 | $2,112 | $34,830 | $8,090 | $26,740 |
| 2016 | $2,328 | $35,150 | $6,060 | $29,090 |
| 2015 | $2,114 | $35,150 | $6,060 | $29,090 |
| 2014 | $2,119 | $35,150 | $6,060 | $29,090 |
| 2013 | $1,045 | $35,140 | $6,055 | $29,085 |
Source: Public Records
Map
Nearby Homes
- 277 S James Rd
- 297 S James Rd
- 247 S James Rd
- 430 S James Rd
- 3160 Fair Ave
- 184 S Hampton Rd
- 201 S Weyant Ave
- 560 S Kellner Rd
- 50 S Chesterfield Rd
- 565 S Kellner Rd
- 178 S Weyant Ave
- 142 S Gould Rd
- 523 S Napoleon Ave
- 635 Elizabeth Ave
- 123 S Gould Rd
- 618 Eastmoor Blvd
- 59 N Everett Ave
- 616 Eastmoor Blvd Unit 478
- 47 N Chesterfield Rd
- 73 N Everett Ave
- 261 S James Rd
- 285 S James Rd
- 255 S James Rd
- 266 S Kellner Rd
- 278 S Kellner Rd
- 250 S Kellner Rd
- 278 S James Rd
- 278 S James Rd
- 268 S James Rd
- 284 S James Rd
- 241 S James Rd
- 260 S James Rd
- 240 S Kellner Rd
- 286 S Kellner Rd
- 292 James Rd
- 292 S James Rd
- 252 S James Rd
- 300 S James Rd
- 233 S James Rd
- 307 James Rd