Estimated Value: $84,000 - $170,000
3
Beds
2
Baths
1,316
Sq Ft
$95/Sq Ft
Est. Value
About This Home
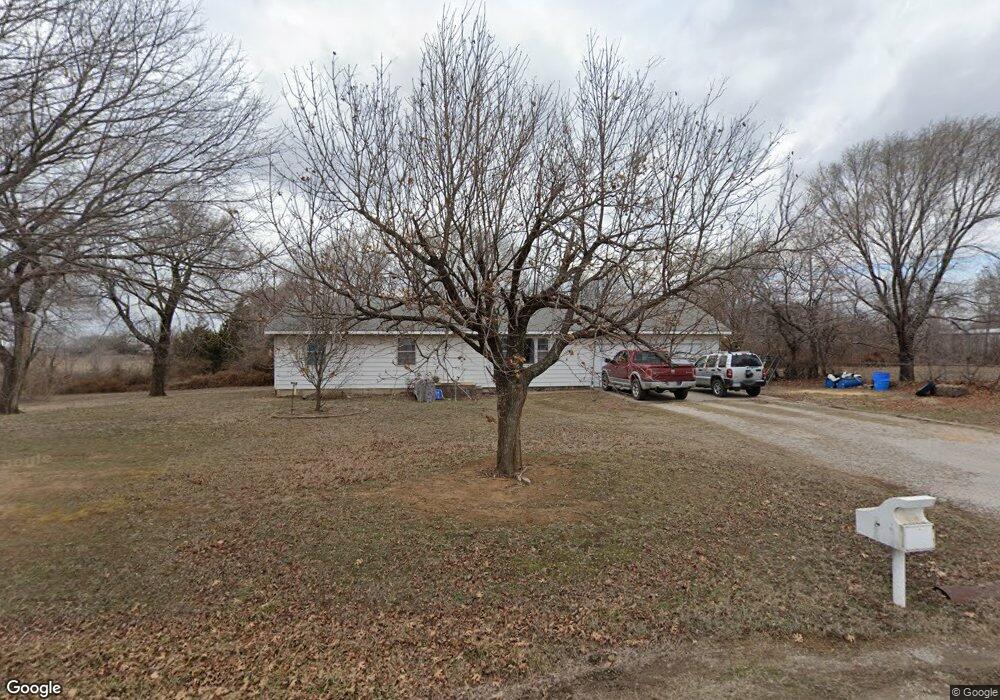
This home is located at 271 S Johnson St, Copan, OK 74022 and is currently estimated at $124,724, approximately $94 per square foot. 271 S Johnson St is a home located in Washington County with nearby schools including Copan Elementary School and Copan High School.
Ownership History
Date
Name
Owned For
Owner Type
Purchase Details
Closed on
May 29, 2025
Sold by
John H Chaney Sr Trust and Woody Julie K
Bought by
Julie Kay Woody Trust and Woody
Current Estimated Value
Purchase Details
Closed on
Jun 3, 2010
Sold by
Huff Gale and Huff Larry
Bought by
Woody Jullie K
Home Financials for this Owner
Home Financials are based on the most recent Mortgage that was taken out on this home.
Original Mortgage
$15,000
Interest Rate
4.73%
Mortgage Type
Stand Alone Second
Purchase Details
Closed on
May 18, 2001
Sold by
Huff Willis S and Huff Metta M
Create a Home Valuation Report for This Property
The Home Valuation Report is an in-depth analysis detailing your home's value as well as a comparison with similar homes in the area
Purchase History
| Date | Buyer | Sale Price | Title Company |
|---|---|---|---|
| Julie Kay Woody Trust | -- | None Listed On Document | |
| Julie Kay Woody Trust | -- | None Listed On Document | |
| Woody Jullie K | $107,000 | -- | |
| -- | -- | -- |
Source: Public Records
Mortgage History
| Date | Status | Borrower | Loan Amount |
|---|---|---|---|
| Previous Owner | Woody Jullie K | $15,000 | |
| Previous Owner | Woody Jullie K | $100,562 |
Source: Public Records
Tax History
| Year | Tax Paid | Tax Assessment Tax Assessment Total Assessment is a certain percentage of the fair market value that is determined by local assessors to be the total taxable value of land and additions on the property. | Land | Improvement |
|---|---|---|---|---|
| 2025 | $969 | $11,098 | $462 | $10,636 |
| 2024 | $944 | $10,807 | $462 | $10,345 |
| 2023 | $944 | $10,807 | $462 | $10,345 |
| 2022 | $928 | $10,808 | $462 | $10,346 |
| 2021 | $1,103 | $12,439 | $242 | $12,197 |
| 2020 | $1,055 | $12,439 | $242 | $12,197 |
| 2019 | $1,064 | $12,439 | $242 | $12,197 |
| 2018 | $1,065 | $12,439 | $242 | $12,197 |
| 2017 | $1,062 | $12,439 | $242 | $12,197 |
| 2016 | $1,053 | $12,439 | $242 | $12,197 |
| 2015 | $974 | $12,439 | $242 | $12,197 |
| 2014 | $1,078 | $12,439 | $242 | $12,197 |
Source: Public Records
Map
Nearby Homes
- 400 S Caney St
- 412 E Golden Ave
- N 3975th Rd
- 1051 N Caney St
- 0 Rural Route Unit 24764392
- 401341 Oklahoma 10
- 000 W 1000 Rd
- 0 W 1100 Rd
- 0000 W 1000 Rd
- 190Ac 4 Mile Rd
- 5 N 3990 Rd
- 6 N 3990 Rd
- 8 N 3990 Rd
- 2 N 3990 Rd
- 402575 W 700 Rd
- 396950 W 1300 Rd
- 13700 N 3980 Rd
- 13699 N 3980 Rd
- 2130 N Osage Ave
- 940 N Ross Ave
- 261 S Johnson St
- 251 S Johnson St
- 231 S Johnson St
- 612 E Edens Ave
- 109 S Johnson St
- 118 S Baker St
- 610 E Edens Ave
- 0 Johnson St
- 107 S Johnson St
- 400 S Bryan St
- 119 S Baker St
- 142 S Bryan St
- 118 S Short St
- 105 S Johnson St
- 140 S Bryan St
- 250 S Bryan St
- 112 S Baker St
- 607 E Edens Ave
- 115 S Baker St
- 138 S Bryan St
Your Personal Tour Guide
Ask me questions while you tour the home.