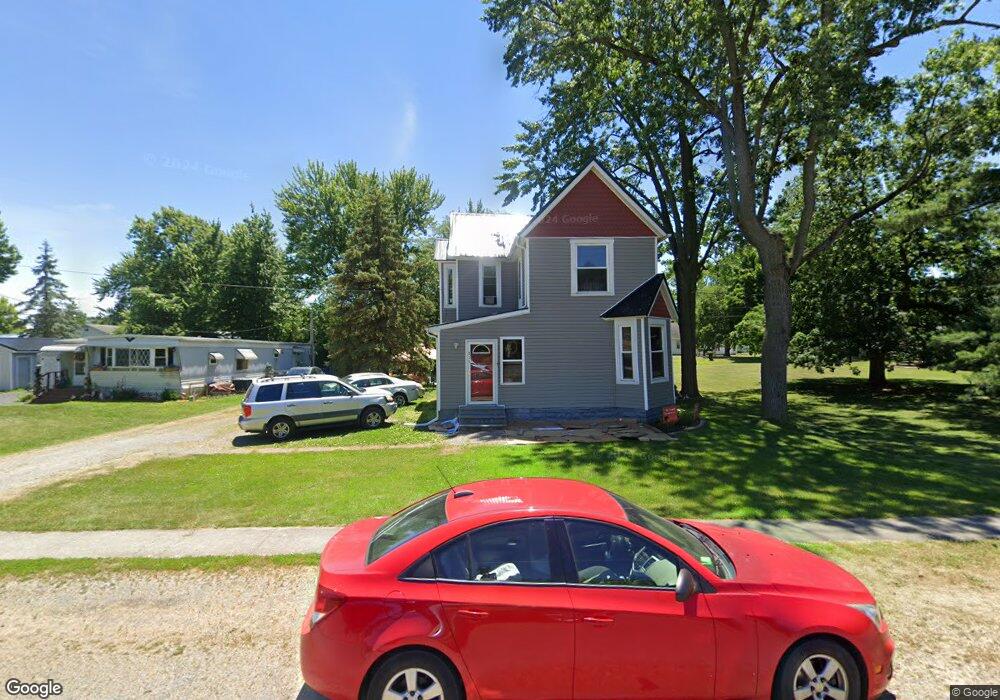
271 S Main St Mc Comb, OH 45858
McComb NeighborhoodEstimated Value: $127,060 - $164,000
4
Beds
2
Baths
1,634
Sq Ft
$93/Sq Ft
Est. Value
About This Home
This home is located at 271 S Main St, Mc Comb, OH 45858 and is currently estimated at $152,015, approximately $93 per square foot. 271 S Main St is a home with nearby schools including McComb Elementary School, McComb Middle School, and Mccomb Local High School.
Ownership History
Date
Name
Owned For
Owner Type
Purchase Details
Closed on
Nov 18, 2010
Sold by
Moser Melissa April
Bought by
Mosser Rena Marie
Current Estimated Value
Purchase Details
Closed on
Feb 28, 1986
Bought by
Collingwood Craig E
Purchase Details
Closed on
Oct 23, 1985
Bought by
Collingwood Craig E
Purchase Details
Closed on
Jan 31, 1984
Bought by
Adm Veterans Affairs
Create a Home Valuation Report for This Property
The Home Valuation Report is an in-depth analysis detailing your home's value as well as a comparison with similar homes in the area
Home Values in the Area
Average Home Value in this Area
Purchase History
| Date | Buyer | Sale Price | Title Company |
|---|---|---|---|
| Mosser Rena Marie | $36,066 | Attorney | |
| Collingwood Craig E | -- | -- | |
| Collingwood Craig E | -- | -- | |
| Adm Veterans Affairs | -- | -- |
Source: Public Records
Tax History
| Year | Tax Paid | Tax Assessment Tax Assessment Total Assessment is a certain percentage of the fair market value that is determined by local assessors to be the total taxable value of land and additions on the property. | Land | Improvement |
|---|---|---|---|---|
| 2024 | $1,057 | $31,130 | $5,150 | $25,980 |
| 2023 | $1,051 | $31,130 | $5,150 | $25,980 |
| 2022 | $1,251 | $31,130 | $5,150 | $25,980 |
| 2021 | $1,036 | $23,220 | $5,150 | $18,070 |
| 2020 | $904 | $23,220 | $5,150 | $18,070 |
| 2019 | $990 | $23,220 | $5,150 | $18,070 |
| 2018 | $886 | $21,750 | $3,680 | $18,070 |
| 2017 | $891 | $21,750 | $3,680 | $18,070 |
| 2016 | $818 | $21,750 | $3,680 | $18,070 |
| 2015 | $711 | $18,310 | $3,150 | $15,160 |
| 2014 | $723 | $18,310 | $3,150 | $15,160 |
| 2012 | $887 | $21,420 | $3,150 | $18,270 |
Source: Public Records
Map
Nearby Homes
- 257 S Main St
- 203 E Perrin Ave
- 128 S Liberty St
- 131 E South St
- 125 Park Dr N
- 223 Cherry St
- 4609 Township Road 235
- 3470 Ohio 235
- 4134 County Road 203
- 7514 Township Road 95
- 4014 County Road 139
- 0 Rock Candy Rd Unit Lot 159
- 0 Rock Candy Rd Unit Lot 170
- 0 Rock Candy Rd Unit Lot 172 206819
- 0 Rock Candy Rd Unit Lot 162
- 0 Rock Candy Rd Unit Lot 171
- 0 Rock Candy Rd Unit Lot 168
- 9894 Smokies Way
- 0 Rock Candy Rd Or Bushwillow Dr Unit Lot 173
- 0 Bearcat Way Or Rock Candy Rd Unit Lot 167
Your Personal Tour Guide
Ask me questions while you tour the home.