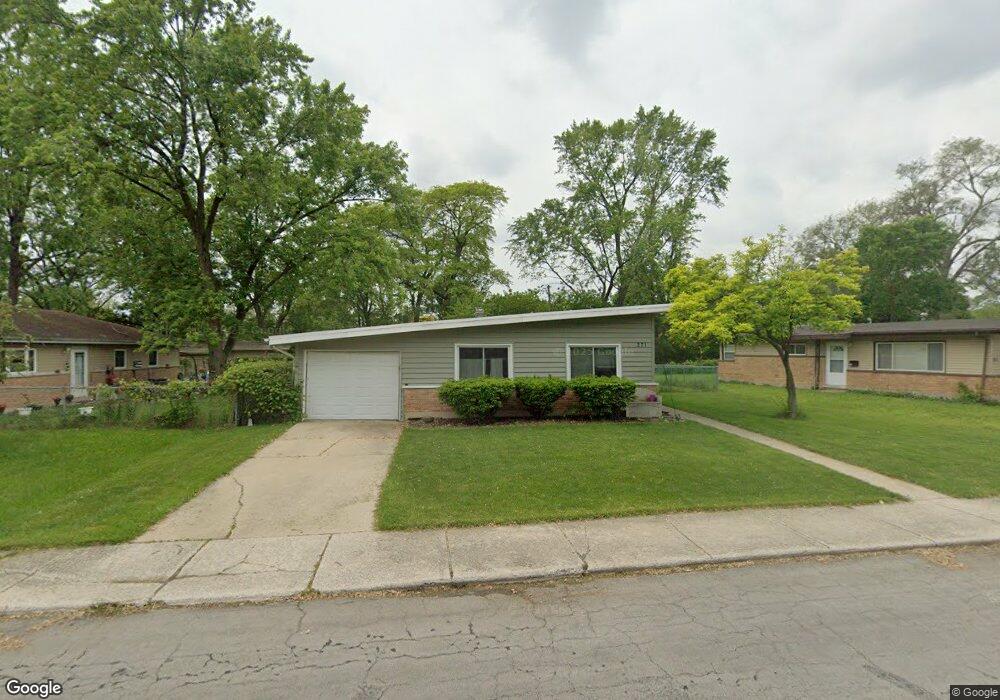
271 Sangamon St Park Forest, IL 60466
Estimated Value: $124,000 - $165,000
3
Beds
1
Bath
1,092
Sq Ft
$131/Sq Ft
Est. Value
About This Home
This home is located at 271 Sangamon St, Park Forest, IL 60466 and is currently estimated at $142,561, approximately $130 per square foot. 271 Sangamon St is a home located in Cook County with nearby schools including Mohawk Primary Center, Michelle Obama School of Technology, and Barack Obama School of Leadership and STEM.
Ownership History
Date
Name
Owned For
Owner Type
Purchase Details
Closed on
Feb 14, 2024
Sold by
Wagener Richard A and Wagener Paula D
Bought by
Richard And Paula Wagener Living Trust and Wagener
Current Estimated Value
Purchase Details
Closed on
Mar 3, 1997
Sold by
Olsen Timothy W and Dominik Jody M
Bought by
Wagener Richard A and Wagener Paula D
Home Financials for this Owner
Home Financials are based on the most recent Mortgage that was taken out on this home.
Original Mortgage
$64,350
Interest Rate
7.93%
Purchase Details
Closed on
May 27, 1994
Sold by
Kelly Darren D and Kelly Christine E
Bought by
Olsen Timothy W and Dominik Jody M
Home Financials for this Owner
Home Financials are based on the most recent Mortgage that was taken out on this home.
Original Mortgage
$64,600
Interest Rate
8.58%
Create a Home Valuation Report for This Property
The Home Valuation Report is an in-depth analysis detailing your home's value as well as a comparison with similar homes in the area
Home Values in the Area
Average Home Value in this Area
Purchase History
| Date | Buyer | Sale Price | Title Company |
|---|---|---|---|
| Richard And Paula Wagener Living Trust | -- | None Listed On Document | |
| Wagener Richard A | $71,500 | -- | |
| Olsen Timothy W | $68,000 | Intercounty Title |
Source: Public Records
Mortgage History
| Date | Status | Borrower | Loan Amount |
|---|---|---|---|
| Previous Owner | Wagener Richard A | $64,350 | |
| Previous Owner | Olsen Timothy W | $64,600 |
Source: Public Records
Tax History Compared to Growth
Tax History
| Year | Tax Paid | Tax Assessment Tax Assessment Total Assessment is a certain percentage of the fair market value that is determined by local assessors to be the total taxable value of land and additions on the property. | Land | Improvement |
|---|---|---|---|---|
| 2024 | $7,018 | $12,905 | $2,477 | $10,428 |
| 2023 | $3,068 | $12,905 | $2,477 | $10,428 |
| 2022 | $3,068 | $5,703 | $2,300 | $3,403 |
| 2021 | $3,129 | $5,702 | $2,299 | $3,403 |
| 2020 | $3,128 | $5,702 | $2,299 | $3,403 |
| 2019 | $2,872 | $6,068 | $2,122 | $3,946 |
| 2018 | $2,761 | $6,068 | $2,122 | $3,946 |
| 2017 | $2,807 | $6,068 | $2,122 | $3,946 |
| 2016 | $2,709 | $5,222 | $1,945 | $3,277 |
| 2015 | $2,525 | $5,222 | $1,945 | $3,277 |
| 2014 | $2,502 | $5,222 | $1,945 | $3,277 |
| 2013 | $3,351 | $6,596 | $1,945 | $4,651 |
Source: Public Records
Map
Nearby Homes
- 263 Sangamon St
- 312 Sangamon St
- 256 Sangamon St
- 316 Sangamon St
- 317 Sangamon St
- 257 Miami St
- 254 Blackhawk Dr
- 301 Seneca St
- 252 Blackhawk Dr
- 339 Shabbona Dr
- 311 Seneca St
- 443 Shabbona Dr
- 240 Miami St
- 240 Mantua St
- 329 Blackhawk Dr
- 321 Shawnee St
- 323 Shawnee St
- 317 Mohawk St
- 304 Somonauk St
- 13 Mantua Ct
- 273 Sangamon St
- 2 Sangamon Ct
- 4 Sangamon Ct
- 413 Shabbona Dr
- 415 Shabbona Dr
- 275 Sangamon St
- 6 Sangamon Ct
- 270 Sangamon St
- 268 Sangamon St
- 272 Sangamon St
- 266 Sangamon St
- 265 Sangamon St
- 419 Shabbona Dr
- 274 Sangamon St
- 8 Sangamon Ct
- 3 Sangamon Ct
- 264 Sangamon St
- 421 Shabbona Dr
- 405 Shabbona Dr
- 262 Sangamon St