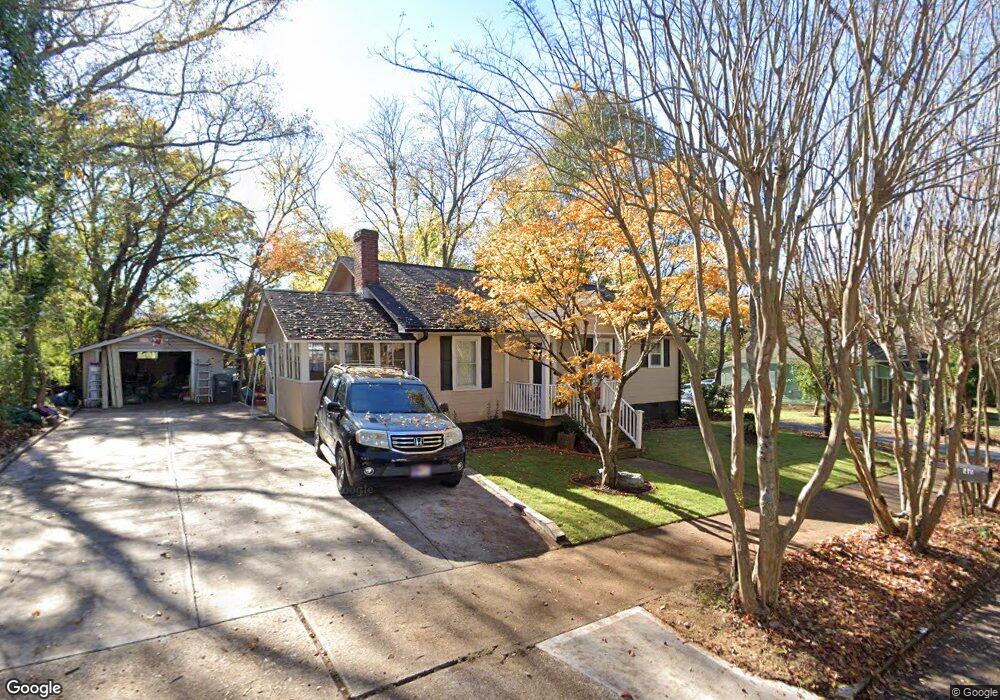
271 Scott Mill Rd Canton, GA 30114
Estimated Value: $164,000 - $285,000
3
Beds
1
Bath
1,267
Sq Ft
$173/Sq Ft
Est. Value
About This Home
This home is located at 271 Scott Mill Rd, Canton, GA 30114 and is currently estimated at $218,875, approximately $172 per square foot. 271 Scott Mill Rd is a home located in Cherokee County with nearby schools including Hasty Elementary School Fine Arts Academy, Teasley Middle School, and Cherokee High School.
Ownership History
Date
Name
Owned For
Owner Type
Purchase Details
Closed on
Aug 29, 2024
Sold by
Dehoff Robert L
Bought by
Gutierrez Antonia Esperanza Tzoc
Current Estimated Value
Purchase Details
Closed on
Feb 3, 2011
Sold by
Dehoff Robert L and Dehoff Annette M
Bought by
Dehoff Robert L Trust
Purchase Details
Closed on
Sep 9, 2008
Sold by
Deutsche Bank Natl Trust Co
Bought by
Morgan Stanley Trust 2006-2
Purchase Details
Closed on
May 6, 2008
Sold by
Tuttle Kenneth
Bought by
Deutsche Bank National Trust C
Purchase Details
Closed on
Feb 5, 1999
Sold by
Sec Hud
Bought by
Tuttle Tabitha D
Home Financials for this Owner
Home Financials are based on the most recent Mortgage that was taken out on this home.
Original Mortgage
$45,110
Interest Rate
6.79%
Purchase Details
Closed on
May 5, 1998
Sold by
Irwin Mtg Corp
Bought by
Sec-Hud
Purchase Details
Closed on
Sep 13, 1996
Sold by
Johnson Naomi
Bought by
Lovell Shawn Rebecca
Create a Home Valuation Report for This Property
The Home Valuation Report is an in-depth analysis detailing your home's value as well as a comparison with similar homes in the area
Home Values in the Area
Average Home Value in this Area
Purchase History
| Date | Buyer | Sale Price | Title Company |
|---|---|---|---|
| Gutierrez Antonia Esperanza Tzoc | -- | -- | |
| Dehoff Robert L Trust | -- | -- | |
| Morgan Stanley Trust 2006-2 | -- | -- | |
| Deutsche Bank National Trust C | $62,031 | -- | |
| Tuttle Tabitha D | -- | -- | |
| Sec-Hud | $58,300 | -- | |
| Irwin Mtg Corp | $58,300 | -- | |
| Lovell Shawn Rebecca | $54,000 | -- |
Source: Public Records
Mortgage History
| Date | Status | Borrower | Loan Amount |
|---|---|---|---|
| Previous Owner | Tuttle Tabitha D | $45,110 | |
| Closed | Lovell Shawn Rebecca | $0 |
Source: Public Records
Tax History
| Year | Tax Paid | Tax Assessment Tax Assessment Total Assessment is a certain percentage of the fair market value that is determined by local assessors to be the total taxable value of land and additions on the property. | Land | Improvement |
|---|---|---|---|---|
| 2025 | $1,528 | $53,120 | $11,200 | $41,920 |
| 2024 | $1,320 | $46,120 | $11,200 | $34,920 |
| 2023 | $1,321 | $46,040 | $11,200 | $34,840 |
| 2022 | $1,304 | $45,440 | $11,200 | $34,240 |
| 2021 | $1,322 | $43,360 | $11,200 | $32,160 |
| 2020 | $1,052 | $34,480 | $8,160 | $26,320 |
| 2019 | $916 | $30,000 | $8,160 | $21,840 |
| 2018 | $767 | $24,960 | $7,040 | $17,920 |
| 2017 | $688 | $55,600 | $4,800 | $17,440 |
| 2016 | $568 | $55,200 | $4,800 | $17,280 |
| 2015 | $481 | $46,300 | $3,840 | $14,680 |
| 2014 | $470 | $36,500 | $3,840 | $10,760 |
Source: Public Records
Map
Nearby Homes
- 120 E Killian St
- 241 E Killian St
- 251 E Killian St
- 122 W South St
- 176 Railroad St
- 200 Lakeside Place
- 168 Railroad St
- 180 Railroad St
- 172 Railroad St
- 701 Longview Dr
- 727 Lower Scott Mill Rd
- 590 Killian Rd
- 407 Cherubs Smile
- 350 Herndon Ln
- 218 Redbud Rd
- 151 Ridgeway Rd
- 308 Morning Frost
- 206 Brick Mill Dr
- 511 Autumn Echo
- 302 and 304 Garland Way
- 107 Alexander St
- 281 Scott Mill Rd
- 250 Scott Mill Rd
- 231 Scott Mill Rd
- 230 Scott Mill Rd
- 290 Scott Mill Rd
- 260 Scott Mill Rd
- 105 Alexander St
- 220 Scott Mill Rd
- 220 Edwards St
- 104 Alexander St
- 211 Scott Mill Rd
- 280 Scott Mill Rd
- 311 Scott Mill Rd
- 210 Scott Mill Rd
- 190 Edwards St
- 230 Edwards St
- 180 Edwards St
- 191 Scott Mill Rd
- 270 Scott Mill Rd