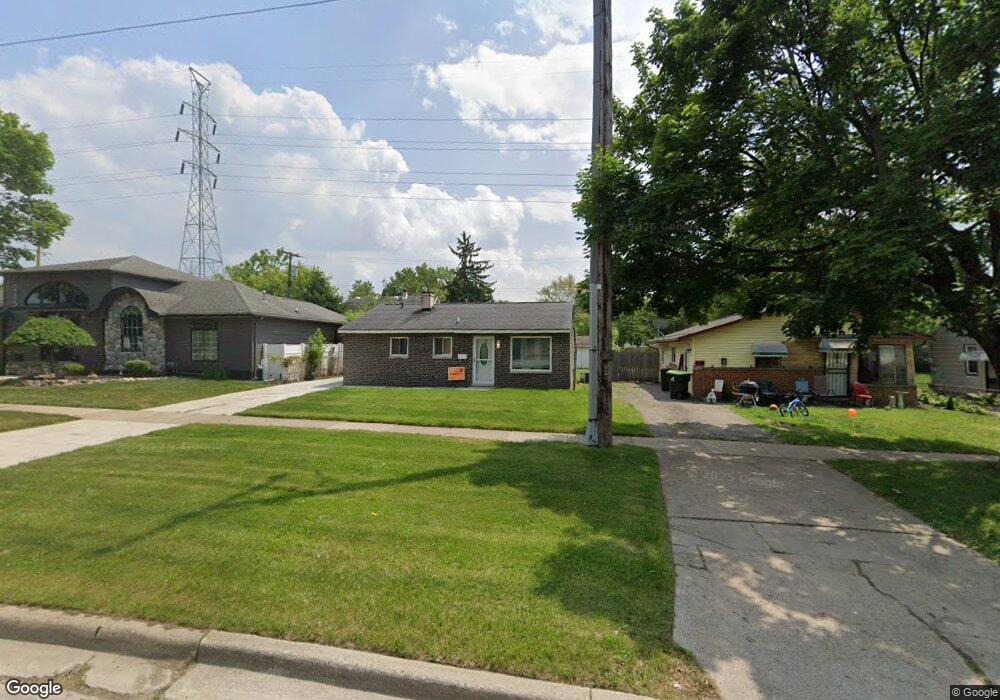
271 South Blvd W Pontiac, MI 48341
Estimated Value: $93,715 - $108,000
3
Beds
1
Bath
882
Sq Ft
$113/Sq Ft
Est. Value
About This Home
This home is located at 271 South Blvd W, Pontiac, MI 48341 and is currently estimated at $99,679, approximately $113 per square foot. 271 South Blvd W is a home located in Oakland County with nearby schools including Walt Whitman Elementary School, Pontiac Middle School, and Pontiac High School.
Ownership History
Date
Name
Owned For
Owner Type
Purchase Details
Closed on
Oct 24, 2022
Sold by
Nix Sandra L
Bought by
Woods Attaria C
Current Estimated Value
Purchase Details
Closed on
May 4, 2017
Sold by
Norfolk Letroy
Bought by
Nix Sandra L
Purchase Details
Closed on
Dec 27, 2016
Sold by
Hayes Keon
Bought by
Norfolk Latroy
Purchase Details
Closed on
Oct 28, 2016
Sold by
Dawson Yahela
Bought by
Hayes Keon
Purchase Details
Closed on
Jul 22, 2016
Sold by
Oakland County
Bought by
Dawson Yahela
Purchase Details
Closed on
Nov 12, 2010
Sold by
Woods James E and Woods Lorine M
Bought by
Woods Attaria C
Purchase Details
Closed on
Feb 22, 2010
Sold by
Woods James E and Woods Lorine M
Bought by
Woods James E and Woods Lorine M
Purchase Details
Closed on
Dec 16, 2009
Sold by
Smith Gladys
Bought by
Woods James
Purchase Details
Closed on
May 12, 2004
Sold by
Woods James E and Woods Lorine M
Bought by
Smith Gladys M
Create a Home Valuation Report for This Property
The Home Valuation Report is an in-depth analysis detailing your home's value as well as a comparison with similar homes in the area
Home Values in the Area
Average Home Value in this Area
Purchase History
| Date | Buyer | Sale Price | Title Company |
|---|---|---|---|
| Woods Attaria C | -- | -- | |
| Nix Sandra L | -- | None Available | |
| Norfolk Latroy | -- | None Available | |
| Hayes Keon | -- | None Available | |
| Dawson Yahela | $14,000 | None Available | |
| Woods Attaria C | -- | None Available | |
| Woods James E | -- | None Available | |
| Woods James E | -- | None Available | |
| Woods James | -- | None Available | |
| Smith Gladys M | -- | Landamerica Lawyers Title |
Source: Public Records
Tax History Compared to Growth
Tax History
| Year | Tax Paid | Tax Assessment Tax Assessment Total Assessment is a certain percentage of the fair market value that is determined by local assessors to be the total taxable value of land and additions on the property. | Land | Improvement |
|---|---|---|---|---|
| 2024 | $499 | $23,120 | $0 | $0 |
| 2023 | $476 | $21,140 | $0 | $0 |
| 2022 | $747 | $18,340 | $0 | $0 |
| 2021 | $1,042 | $16,370 | $0 | $0 |
| 2020 | $646 | $14,870 | $0 | $0 |
| 2019 | $697 | $13,070 | $0 | $0 |
| 2018 | $864 | $11,290 | $0 | $0 |
| 2017 | $645 | $11,160 | $0 | $0 |
| 2016 | $394 | $10,790 | $0 | $0 |
| 2015 | -- | $9,970 | $0 | $0 |
| 2014 | -- | $8,880 | $0 | $0 |
| 2011 | -- | $15,240 | $0 | $0 |
Source: Public Records
Map
Nearby Homes
- 305 South Blvd W
- 200 Crystal Lake Dr
- 598 Montana Ave
- 151 South Blvd W
- 534 Nevada Ave
- 472 Wyoming Ave
- 228 Hughes Ave
- 232 Hughes Ave
- 215 Hughes Ave
- 185 Hughes Ave
- 240 Hughes Ave
- 248 Hughes Ave
- 466 Colorado Ave
- 371 Nebraska Ave
- 288 Hughes Ave
- 485 Colorado Ave
- 608 Nevada Ave
- 587 California Ave
- 605 Nebraska Ave
- 533 California Ave
- 265 South Blvd W
- 464 Montana Ave
- 277 South Blvd W
- 478 Montana Ave
- 456 Montana Ave
- 281 South Blvd W
- 285 South Blvd W
- 486 Montana Ave
- 488 Montana Ave
- 268 South Blvd W
- 289 South Blvd W
- 272 South Blvd W
- 388 Franklin Rd
- 260 South Blvd W
- 293 South Blvd W
- 276 South Blvd W
- 471 Montana Ave
- 475 Montana Ave
- 465 Montana Ave
- 494 Montana Ave