Estimated Value: $298,000 - $336,000
3
Beds
2
Baths
2,100
Sq Ft
$152/Sq Ft
Est. Value
About This Home
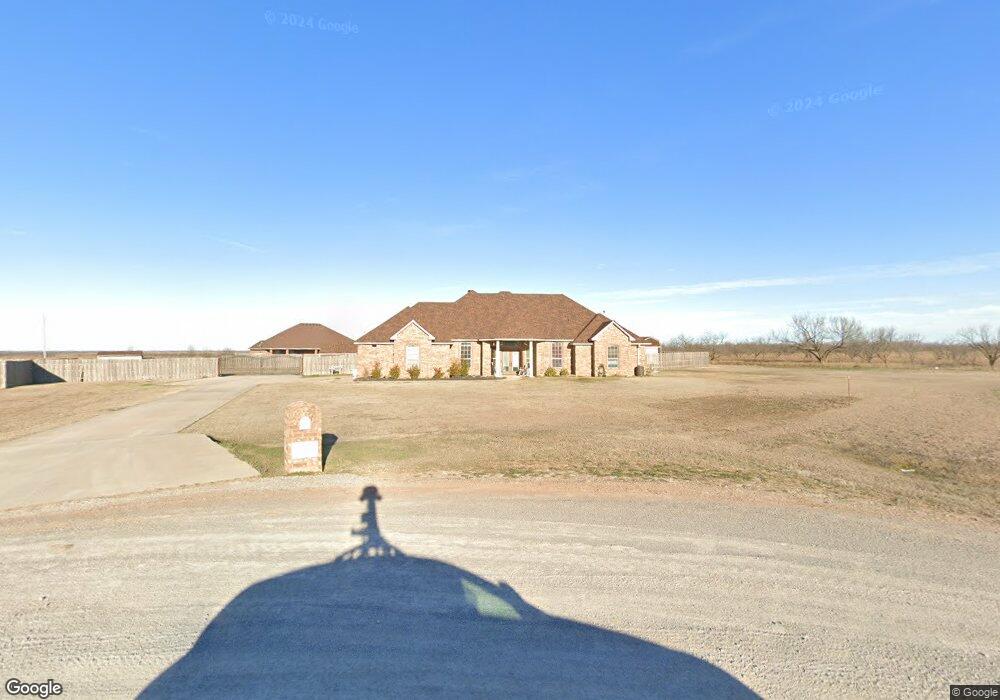
This home is located at 271 SW Deyo Landing Loop, Cache, OK 73527 and is currently estimated at $319,076, approximately $151 per square foot. 271 SW Deyo Landing Loop is a home located in Comanche County with nearby schools including Cache Primary Elementary School, Cache Intermediate Elementary School, and Cache Middle School.
Ownership History
Date
Name
Owned For
Owner Type
Purchase Details
Closed on
Dec 19, 2011
Sold by
Fink Brian D and Fink Valerie A
Bought by
Camp Samuel M and Camp Belle
Current Estimated Value
Home Financials for this Owner
Home Financials are based on the most recent Mortgage that was taken out on this home.
Original Mortgage
$204,900
Outstanding Balance
$139,789
Interest Rate
4.03%
Mortgage Type
New Conventional
Estimated Equity
$179,287
Purchase Details
Closed on
Oct 17, 2008
Sold by
Menge David L and Menge Debbie
Bought by
Fink Brian D and Fink Valerie A
Home Financials for this Owner
Home Financials are based on the most recent Mortgage that was taken out on this home.
Original Mortgage
$200,000
Interest Rate
6%
Mortgage Type
Future Advance Clause Open End Mortgage
Purchase Details
Closed on
Aug 11, 2008
Sold by
Wren Sammy L and Wren Angelena
Bought by
Menge David L and Menge Debbie
Purchase Details
Closed on
May 25, 2007
Sold by
Lichtl Paul
Bought by
Wren Sammy L and Wren Angelena
Create a Home Valuation Report for This Property
The Home Valuation Report is an in-depth analysis detailing your home's value as well as a comparison with similar homes in the area
Purchase History
| Date | Buyer | Sale Price | Title Company |
|---|---|---|---|
| Camp Samuel M | $205,000 | None Available | |
| Fink Brian D | $20,000 | -- | |
| Menge David L | $17,500 | -- | |
| Wren Sammy L | $16,500 | -- | |
| Wren Sammy L | $16,500 | -- |
Source: Public Records
Mortgage History
| Date | Status | Borrower | Loan Amount |
|---|---|---|---|
| Open | Camp Samuel M | $204,900 | |
| Previous Owner | Fink Brian D | $200,000 |
Source: Public Records
Tax History
| Year | Tax Paid | Tax Assessment Tax Assessment Total Assessment is a certain percentage of the fair market value that is determined by local assessors to be the total taxable value of land and additions on the property. | Land | Improvement |
|---|---|---|---|---|
| 2025 | $3,036 | $29,545 | $3,305 | $26,240 |
| 2024 | $2,987 | $29,545 | $3,616 | $25,929 |
| 2023 | $2,987 | $27,849 | $2,813 | $25,036 |
| 2022 | $2,930 | $27,038 | $2,813 | $24,225 |
| 2021 | $2,446 | $26,251 | $2,813 | $23,438 |
| 2020 | $2,715 | $26,773 | $2,813 | $23,960 |
| 2019 | $2,754 | $26,999 | $2,813 | $24,186 |
| 2018 | $2,430 | $23,550 | $2,250 | $21,300 |
| 2017 | $2,371 | $23,740 | $2,250 | $21,490 |
| 2016 | $2,240 | $22,819 | $1,800 | $21,019 |
| 2015 | $2,235 | $22,819 | $1,800 | $21,019 |
| 2014 | $2,205 | $22,819 | $1,800 | $21,019 |
Source: Public Records
Map
Nearby Homes
- 7020 SW Deyo Mission Rd
- 6095 SW 112th St
- 8410 SW Coombs Rd
- 33 SW Bradford Ln
- 651 SW Eden Place
- 22 SW Bradford Ln
- 357 SW Matthey Dr
- 22 NW Valleybrook Dr
- TBD SW 82nd & Lee Blvd
- 501 NW Spring Creek Rd
- 3545 SW 67th St
- 1110 SW 78th St
- 6813 SW Oakley
- 12400 NW Pecan Creek Dr
- 5198 SW Bishop Rd
- 52nd SW Bishop Rd
- 5201 SW Bishop Rd
- 2606 SW 68th St
- 2604 SW 68th St
- 127 SW Bishop Rd
- 271 SW Deyo Landing Loop
- 282 SW Deyo Landing Loop
- 221 SW Deyo Landing Loop
- 5084 SW Deyo Mission Rd
- 230 SW Deyo Landing Loop
- 310 SW Deyo Landing Loop
- 5154 SW Deyo Mission Rd
- 386 SW Deyo Landing Loop
- 293 SW Deyo Landing Loop
- S27, T1N, R13W SW Deyo Mission Rd
- S27, T1N, R13W SW Deyo Mission Rd Unit SW/C Deyo Mission &
- 6630 SW Deyo Mission Rd
- 6500 SW Deyo Mission Rd
- 6370 SW Deyo Mission Rd
- 6760 SW Deyo Mission Rd
- 6890 SW Deyo Mission Rd
- 7150 SW Deyo Mission Rd
- 5901 SW Deyo Mission Rd
- 123 SW Deyo Landing Loop
- 306 SW Deyo Landing Loop
Your Personal Tour Guide
Ask me questions while you tour the home.