Estimated Value: $250,763 - $299,000
2
Beds
2
Baths
1,368
Sq Ft
$201/Sq Ft
Est. Value
About This Home
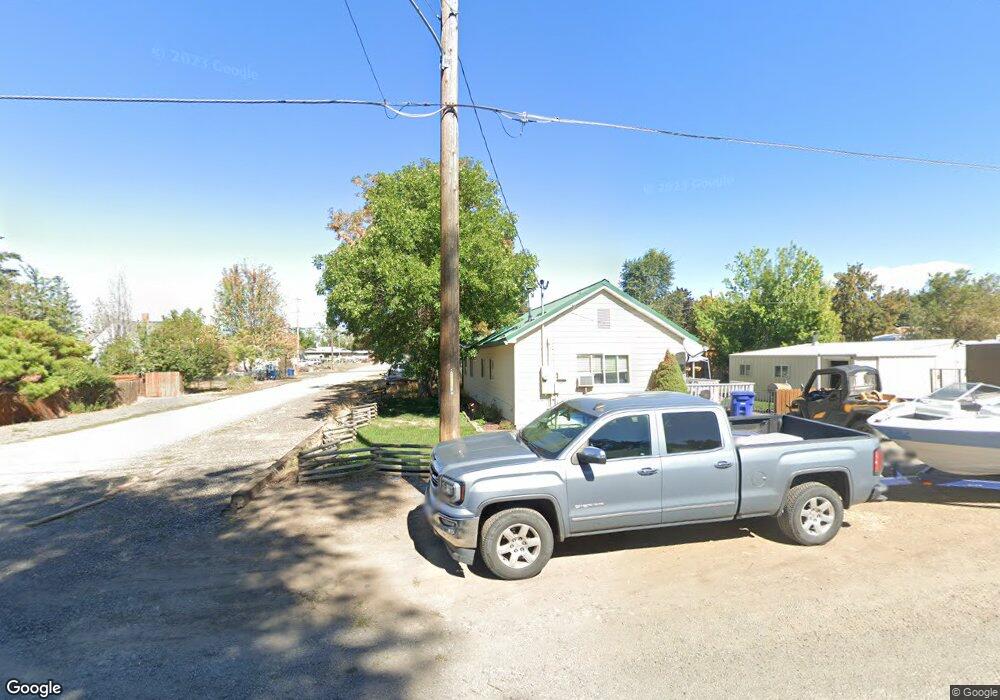
This home is located at 271 W Beakman St, Union, OR 97883 and is currently estimated at $274,882, approximately $200 per square foot. 271 W Beakman St is a home located in Union County with nearby schools including Union Elementary School and Union High School.
Ownership History
Date
Name
Owned For
Owner Type
Purchase Details
Closed on
Oct 17, 2025
Sold by
Braun Lavelle
Bought by
Schwab Jenny and Braw Lavelle
Current Estimated Value
Purchase Details
Closed on
Jul 16, 2018
Sold by
James Andrew W
Bought by
Braun Lavelle
Home Financials for this Owner
Home Financials are based on the most recent Mortgage that was taken out on this home.
Original Mortgage
$80,000
Interest Rate
4.5%
Mortgage Type
Commercial
Purchase Details
Closed on
Oct 19, 2016
Sold by
Friesen Murray J
Bought by
James Andrew W
Home Financials for this Owner
Home Financials are based on the most recent Mortgage that was taken out on this home.
Original Mortgage
$137,391
Interest Rate
3.44%
Mortgage Type
VA
Purchase Details
Closed on
Oct 3, 2008
Sold by
Burns William B and Burns Tiffney L
Bought by
Friesen Murray J
Home Financials for this Owner
Home Financials are based on the most recent Mortgage that was taken out on this home.
Original Mortgage
$88,000
Interest Rate
6.31%
Mortgage Type
New Conventional
Create a Home Valuation Report for This Property
The Home Valuation Report is an in-depth analysis detailing your home's value as well as a comparison with similar homes in the area
Home Values in the Area
Average Home Value in this Area
Purchase History
| Date | Buyer | Sale Price | Title Company |
|---|---|---|---|
| Schwab Jenny | -- | None Listed On Document | |
| Braun Lavelle | $150,000 | Eastern Oregon Title Inc | |
| James Andrew W | $135,000 | Amerititle | |
| Friesen Murray J | $110,000 | Abstract & Title Company |
Source: Public Records
Mortgage History
| Date | Status | Borrower | Loan Amount |
|---|---|---|---|
| Previous Owner | Braun Lavelle | $80,000 | |
| Previous Owner | James Andrew W | $137,391 | |
| Previous Owner | Friesen Murray J | $88,000 |
Source: Public Records
Tax History Compared to Growth
Tax History
| Year | Tax Paid | Tax Assessment Tax Assessment Total Assessment is a certain percentage of the fair market value that is determined by local assessors to be the total taxable value of land and additions on the property. | Land | Improvement |
|---|---|---|---|---|
| 2025 | $1,442 | $101,450 | $22,590 | $78,860 |
| 2024 | $1,280 | $98,500 | $21,940 | $76,560 |
| 2023 | $1,239 | $95,640 | $21,300 | $74,340 |
| 2022 | $1,232 | $92,867 | $20,681 | $72,186 |
| 2021 | $1,198 | $90,163 | $19,966 | $70,197 |
| 2020 | $1,161 | $87,537 | $19,173 | $68,364 |
| 2019 | $1,049 | $84,988 | $19,978 | $65,010 |
| 2018 | $1,020 | $82,513 | $19,403 | $63,110 |
| 2017 | $900 | $80,110 | $20,758 | $59,352 |
| 2016 | $822 | $70,324 | $19,848 | $50,476 |
| 2015 | $690 | $59,652 | $20,643 | $39,009 |
| 2014 | $671 | $57,915 | $20,133 | $37,782 |
| 2013 | -- | $56,229 | $18,296 | $37,933 |
Source: Public Records
Map
Nearby Homes
- 527 S Dewey St
- 362 S 4th St
- 746 W Arch St
- 845 W Arch St
- 610 E Fulton St
- 650 E Chestnut St
- 558 E Fulton St
- 1137 N Bellwood St
- 1115 S 2nd St
- 141 E Bryan Ave
- 240 Heritage Ln
- 61938 High Valley Rd
- 301 High Valley Rd
- 0 Rose Ridge Rd Unit 3
- 0 Rose Ridge Rd Unit 1
- 0 Rose Ridge Rd Unit 22290306
- 0 Rose Ridge Rd Unit 2
- 59926 Comstock Rd
- 0 Ruth Ln Unit 1404 266829379
- 0 Conklin Ln Unit 232609065