
Landlord's Agent in 2022
Carlos Espinoza
Jason Mitchell Group
(240) 426-8627
263 Total Sales
Estimated Value: $511,000 - $526,000
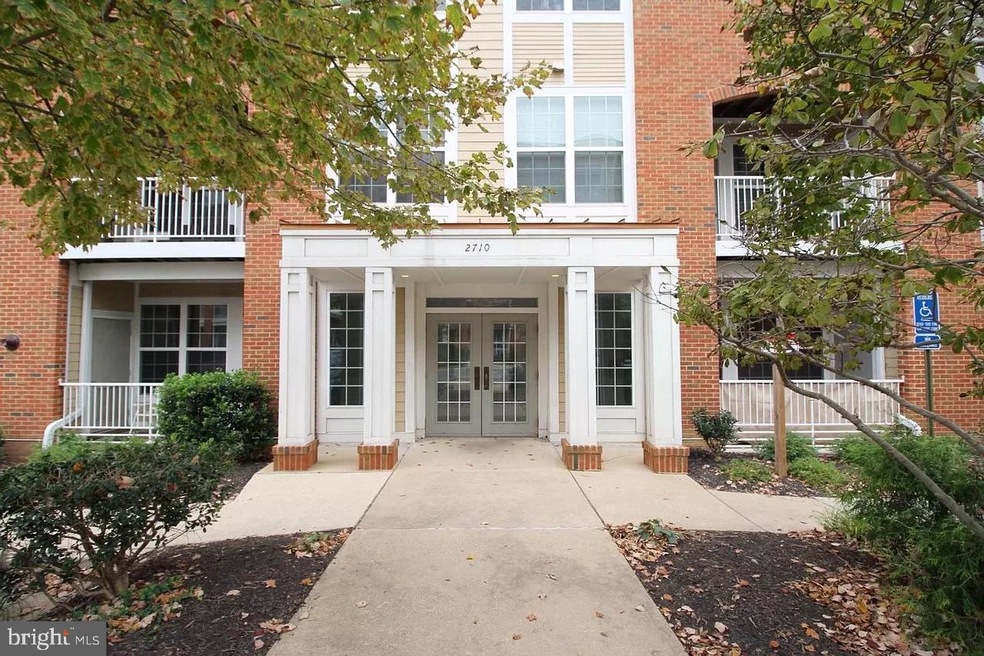
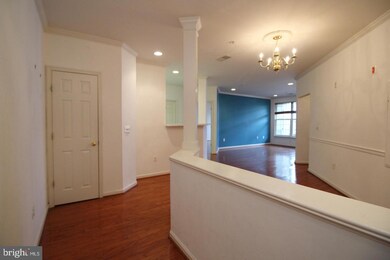
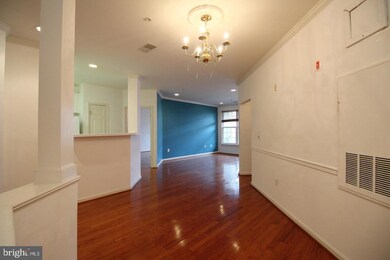
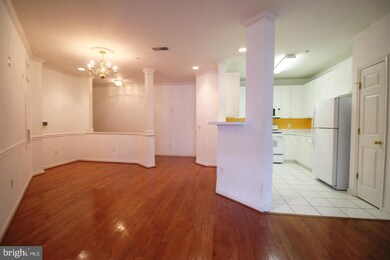
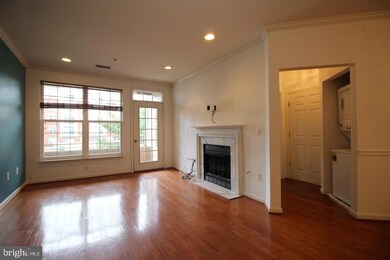
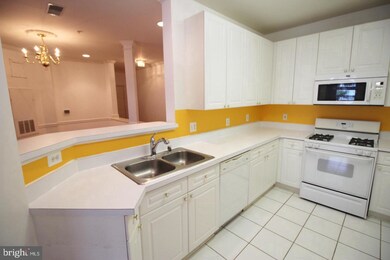
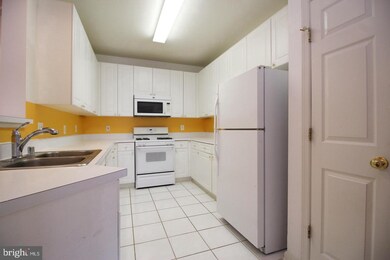
Ideally situated in one of the most desirable locations Northern Virginia has to offer. Commuters dream! with the Dunn Loring Metro Station right next door. Short walk to Harris Teeter, Square dining and retail just across the street. Features 2 Bedrooms, 2 Bath, Beautiful unit w/ secure main entrance. Hardwood floors, balcony , washier & dryer in unit. Two Reserved garage parking and three additional guest parking passes.
| Date | Buyer | Sale Price | Title Company |
|---|---|---|---|
| Saravi Amir | $370,000 | Central Title & Escrow Inc | |
| Ghatta Venkan D | $350,000 | -- | |
| Lee Anna S | $177,800 | -- |
| Date | Status | Borrower | Loan Amount |
|---|---|---|---|
| Open | Saravi Amir | $296,000 | |
| Previous Owner | Ghatta Venkan D | $107,311 | |
| Previous Owner | Ghatta Venkan D | $200,000 | |
| Previous Owner | Ghatta Venkan D | $300,000 | |
| Previous Owner | Lee Anna S | $142,000 |
| Date | Event | Price | Change | Sq Ft Price |
|---|---|---|---|---|
| 07/15/2022 07/15/22 | Rented | $2,250 | 0.0% | -- |
| 07/07/2022 07/07/22 | For Rent | $2,250 | 0.0% | -- |
| 04/05/2022 04/05/22 | Rented | $2,250 | 0.0% | -- |
| 03/28/2022 03/28/22 | Price Changed | $2,250 | -2.2% | $2 / Sq Ft |
| 03/14/2022 03/14/22 | Price Changed | $2,300 | -4.2% | $2 / Sq Ft |
| 03/01/2022 03/01/22 | For Rent | $2,400 | +9.1% | -- |
| 02/28/2019 02/28/19 | Rented | $2,200 | 0.0% | -- |
| 02/27/2019 02/27/19 | Under Contract | -- | -- | -- |
| 02/19/2019 02/19/19 | For Rent | $2,200 | 0.0% | -- |
| 01/15/2019 01/15/19 | Sold | $370,000 | -2.6% | $322 / Sq Ft |
| 12/16/2018 12/16/18 | Pending | -- | -- | -- |
| 10/18/2018 10/18/18 | For Sale | $380,000 | -- | $331 / Sq Ft |
| Year | Tax Paid | Tax Assessment Tax Assessment Total Assessment is a certain percentage of the fair market value that is determined by local assessors to be the total taxable value of land and additions on the property. | Land | Improvement |
|---|---|---|---|---|
| 2024 | $5,180 | $447,140 | $89,000 | $358,140 |
| 2023 | $4,806 | $425,850 | $85,000 | $340,850 |
| 2022 | $4,774 | $417,500 | $84,000 | $333,500 |
| 2021 | $4,666 | $397,620 | $80,000 | $317,620 |
| 2020 | $4,357 | $368,170 | $74,000 | $294,170 |
| 2019 | $3,918 | $331,060 | $66,000 | $265,060 |
| 2018 | $3,524 | $306,430 | $61,000 | $245,430 |
| 2017 | $3,362 | $289,540 | $58,000 | $231,540 |
| 2016 | $3,645 | $314,670 | $63,000 | $251,670 |
| 2015 | $3,443 | $308,500 | $62,000 | $246,500 |
| 2014 | $3,435 | $308,500 | $62,000 | $246,500 |
Landlord's Agent in 2022
Carlos Espinoza
Jason Mitchell Group
(240) 426-8627
263 Total Sales
Seller's Agent in 2019
Sam Nassar
Compass
(703) 310-6111
157 Total Sales
Seller's Agent in 2019
Norval Peabody
Peabody Real Estate LLC
(703) 436-6964
23 Total Sales
J
Buyer's Agent in 2019
Jung Jin
Giant Realty, Inc.
18 Total Sales
Source: Bright MLS
MLS Number: VAFX2081882
APN: 0492-44040309
Disclaimer: Certain information contained herein is derived from information provided by parties other than Homes.com. All information provided is deemed reliable, but is not guaranteed to be accurate and should be independently verified.
![]() The data relating to real estate for sale on this website appears in part through the BRIGHT Internet Data Exchange program, a voluntary cooperative exchange of property listing data between licensed real estate brokerage firms, and is provided by BRIGHT through a licensing agreement.
The data relating to real estate for sale on this website appears in part through the BRIGHT Internet Data Exchange program, a voluntary cooperative exchange of property listing data between licensed real estate brokerage firms, and is provided by BRIGHT through a licensing agreement.
Listing information is from various brokers who participate in the Bright MLS IDX program and not all listings may be visible on the site.
The property information being provided on or through the website is for the personal, non-commercial use of consumers and such information may not be used for any purpose other than to identify prospective properties consumers may be interested in purchasing.
Some properties which appear for sale on the website may no longer be available because they are for instance, under contract, sold or are no longer being offered for sale.
Property information displayed is deemed reliable but is not guaranteed.
Copyright 2025 Bright MLS, Inc.