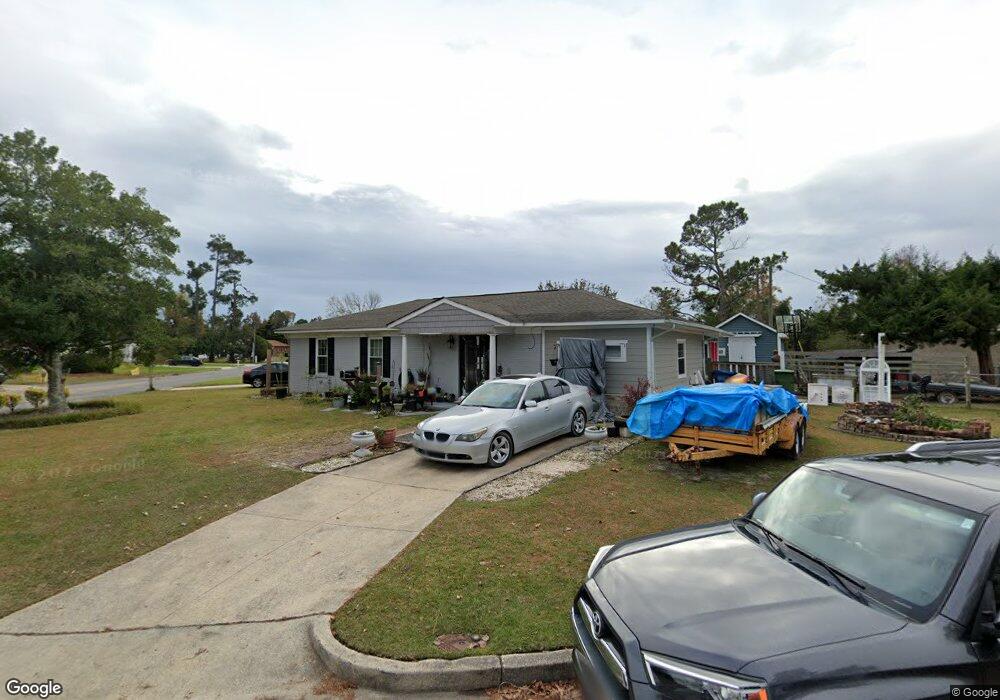
2710 Bunche St Wilmington, NC 28405
Estimated Value: $191,000 - $233,000
3
Beds
1
Bath
1,040
Sq Ft
$208/Sq Ft
Est. Value
About This Home
This home is located at 2710 Bunche St, Wilmington, NC 28405 and is currently estimated at $215,808, approximately $207 per square foot. 2710 Bunche St is a home located in New Hanover County with nearby schools including Wrightsboro Elementary School, Williston Middle School, and Emsley A. Laney High School.
Ownership History
Date
Name
Owned For
Owner Type
Purchase Details
Closed on
Jun 2, 2005
Sold by
King Linda Smith and King George W
Bought by
Xicali Gerardo and Rivera Martinez Georgina
Current Estimated Value
Home Financials for this Owner
Home Financials are based on the most recent Mortgage that was taken out on this home.
Original Mortgage
$66,250
Outstanding Balance
$34,321
Interest Rate
5.74%
Mortgage Type
Purchase Money Mortgage
Estimated Equity
$181,487
Purchase Details
Closed on
May 12, 1993
Sold by
1St Home Federal Sav/Loan Assn
Bought by
Belton Linda Smith
Purchase Details
Closed on
Oct 1, 1992
Sold by
Craig David B Sub Trustee
Bought by
1St Home Federal Sav/Loan Assn
Purchase Details
Closed on
Mar 1, 1982
Sold by
Housing Authority
Bought by
Mitchell Michael D Diane
Purchase Details
Closed on
Jun 1, 1974
Bought by
Housing Authority
Create a Home Valuation Report for This Property
The Home Valuation Report is an in-depth analysis detailing your home's value as well as a comparison with similar homes in the area
Home Values in the Area
Average Home Value in this Area
Purchase History
| Date | Buyer | Sale Price | Title Company |
|---|---|---|---|
| Xicali Gerardo | $68,500 | None Available | |
| Belton Linda Smith | $25,000 | -- | |
| 1St Home Federal Sav/Loan Assn | $36,000 | -- | |
| Mitchell Michael D Diane | -- | -- | |
| Housing Authority | $16,300 | -- |
Source: Public Records
Mortgage History
| Date | Status | Borrower | Loan Amount |
|---|---|---|---|
| Open | Xicali Gerardo | $66,250 |
Source: Public Records
Tax History Compared to Growth
Tax History
| Year | Tax Paid | Tax Assessment Tax Assessment Total Assessment is a certain percentage of the fair market value that is determined by local assessors to be the total taxable value of land and additions on the property. | Land | Improvement |
|---|---|---|---|---|
| 2025 | $1,195 | $203,000 | $42,600 | $160,400 |
| 2023 | $1,095 | $125,900 | $50,100 | $75,800 |
| 2022 | $1,070 | $125,900 | $50,100 | $75,800 |
| 2021 | $1,077 | $125,900 | $50,100 | $75,800 |
| 2020 | $712 | $67,600 | $22,500 | $45,100 |
| 2019 | $712 | $67,600 | $22,500 | $45,100 |
| 2018 | $712 | $67,600 | $22,500 | $45,100 |
| 2017 | $712 | $67,600 | $22,500 | $45,100 |
| 2016 | $827 | $74,600 | $27,000 | $47,600 |
| 2015 | $790 | $74,600 | $27,000 | $47,600 |
| 2014 | $756 | $74,600 | $27,000 | $47,600 |
Source: Public Records
Map
Nearby Homes
- 1604 Kornegay Ave
- 1602 Forbes Ct
- 2603 McClammy St
- 1101 Emory St
- 431 Evans St
- 431-A Evans
- 468 Maides Ave
- 464 Maides Ave
- 421 Evans St
- 460 Maides Ave
- 437 Maides Ave
- 2926 Princess Place Dr
- 607 Sharease Cir
- 2402 Belvedere Dr
- 109 & 113 Clay St
- 222 Evans St
- 2113 Shirley Rd
- 2212 Brandon Rd
- 17 Montgomery Ave
- 110 Clay St
- 1501 Kornegay Ave
- 2708 Bunche St
- 1601 Kornegay Ave
- 1504 Kornegay Ave
- 2706 Bunche St
- 1506 Kornegay Ave
- 2707 Bunche St
- 1502 Kornegay Ave
- 1602 Kornegay Ave
- 1603 Kornegay Ave
- 2705 Bunche St
- 2704 Bunche St
- 1605 Kornegay Ave
- 2703 Bunche St
- 1403 Kornegay Ave
- 2702 Bunche St
- 1606 Kornegay Ave
- 1408 Kornegay Ave
- 1607 Kornegay Ave
- 1605 Forbes Ct