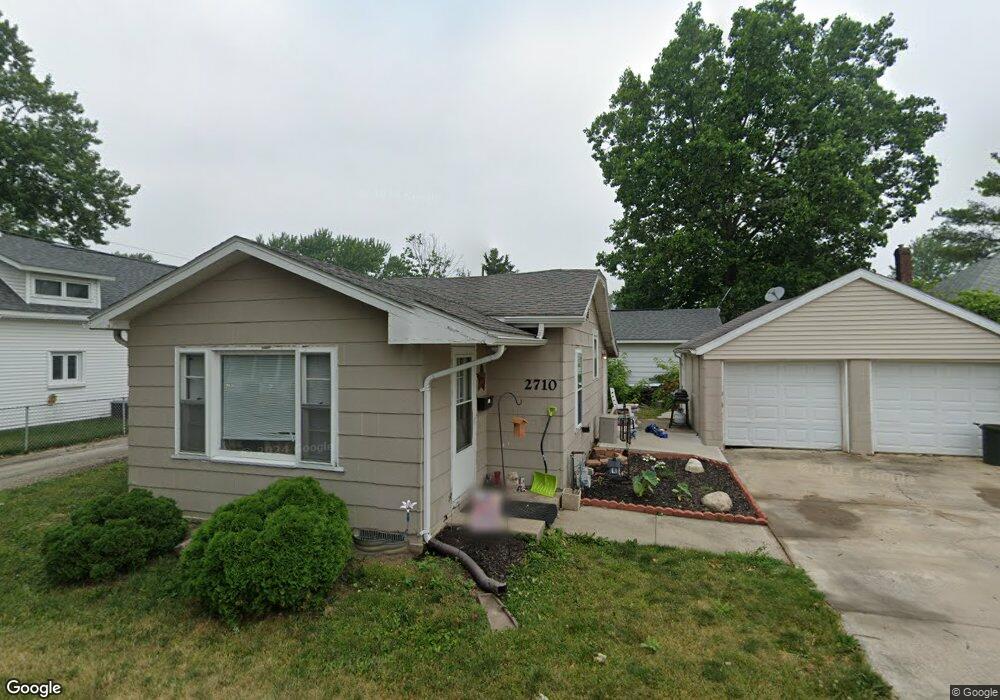
2710 Curtis St Lafayette, IN 47904
Estimated Value: $157,017 - $198,000
--
Bed
--
Bath
866
Sq Ft
$201/Sq Ft
Est. Value
About This Home
This home is located at 2710 Curtis St, Lafayette, IN 47904 and is currently estimated at $174,254, approximately $201 per square foot. 2710 Curtis St is a home located in Tippecanoe County with nearby schools including Oakland Elementary School, Lafayette Tecumseh Junior High School, and Sunnyside Intermediate School.
Ownership History
Date
Name
Owned For
Owner Type
Purchase Details
Closed on
Mar 5, 2021
Sold by
Tetzloff Llc
Bought by
Jmg Holdings Llc
Current Estimated Value
Purchase Details
Closed on
Sep 11, 2002
Sold by
Tetzloff Andy A and Tetzloff Vickie Lee
Bought by
Tetzloff Llc
Home Financials for this Owner
Home Financials are based on the most recent Mortgage that was taken out on this home.
Original Mortgage
$60,000
Interest Rate
6.5%
Mortgage Type
Purchase Money Mortgage
Create a Home Valuation Report for This Property
The Home Valuation Report is an in-depth analysis detailing your home's value as well as a comparison with similar homes in the area
Home Values in the Area
Average Home Value in this Area
Purchase History
| Date | Buyer | Sale Price | Title Company |
|---|---|---|---|
| Jmg Holdings Llc | -- | None Available | |
| Tetzloff Llc | -- | -- |
Source: Public Records
Mortgage History
| Date | Status | Borrower | Loan Amount |
|---|---|---|---|
| Previous Owner | Tetzloff Llc | $60,000 |
Source: Public Records
Tax History Compared to Growth
Tax History
| Year | Tax Paid | Tax Assessment Tax Assessment Total Assessment is a certain percentage of the fair market value that is determined by local assessors to be the total taxable value of land and additions on the property. | Land | Improvement |
|---|---|---|---|---|
| 2024 | $1,920 | $96,000 | $18,000 | $78,000 |
| 2023 | $1,320 | $66,000 | $18,000 | $48,000 |
| 2022 | $1,320 | $66,000 | $18,000 | $48,000 |
| 2021 | $1,234 | $61,700 | $18,000 | $43,700 |
| 2020 | $1,028 | $51,400 | $18,000 | $33,400 |
| 2019 | $1,028 | $51,400 | $16,200 | $35,200 |
| 2018 | $1,028 | $51,400 | $16,200 | $35,200 |
| 2017 | $1,022 | $51,100 | $16,200 | $34,900 |
| 2016 | $1,012 | $50,590 | $16,200 | $34,390 |
| 2014 | $964 | $48,200 | $16,200 | $32,000 |
| 2013 | $936 | $46,800 | $16,200 | $30,600 |
Source: Public Records
Map
Nearby Homes