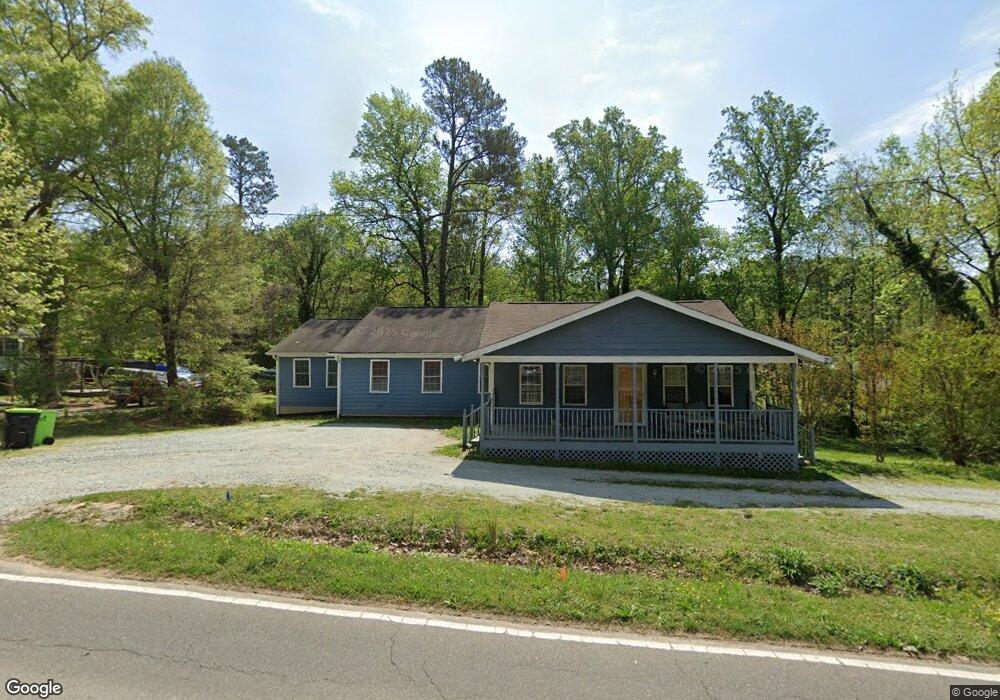
2710 E Geer St Durham, NC 27704
Northeast Durham NeighborhoodEstimated Value: $355,000 - $490,000
3
Beds
2
Baths
2,235
Sq Ft
$196/Sq Ft
Est. Value
About This Home
This home is located at 2710 E Geer St, Durham, NC 27704 and is currently estimated at $438,070, approximately $196 per square foot. 2710 E Geer St is a home located in Durham County with nearby schools including Glenn Elementary, John W Neal Middle School, and Southern School of Energy & Sustainability.
Ownership History
Date
Name
Owned For
Owner Type
Purchase Details
Closed on
Jan 3, 2011
Sold by
Proctor Leroy Carlos and Proctor Shonte
Bought by
Vanie David K
Current Estimated Value
Purchase Details
Closed on
Sep 3, 2009
Sold by
Us Bank National Association
Bought by
Vanie David K and Proctor Leroy C
Purchase Details
Closed on
Nov 26, 2008
Sold by
Mathias Jennifer
Bought by
Us Bank National Association
Purchase Details
Closed on
Jul 27, 2006
Sold by
Morequity
Bought by
Mathias Jennifer L
Home Financials for this Owner
Home Financials are based on the most recent Mortgage that was taken out on this home.
Original Mortgage
$48,800
Interest Rate
6.67%
Mortgage Type
Purchase Money Mortgage
Purchase Details
Closed on
Mar 30, 2006
Sold by
Garner Donna G
Bought by
Morequity Inc
Create a Home Valuation Report for This Property
The Home Valuation Report is an in-depth analysis detailing your home's value as well as a comparison with similar homes in the area
Home Values in the Area
Average Home Value in this Area
Purchase History
| Date | Buyer | Sale Price | Title Company |
|---|---|---|---|
| Vanie David K | -- | None Available | |
| Vanie David K | $33,000 | None Available | |
| Us Bank National Association | $53,331 | None Available | |
| Mathias Jennifer L | $61,000 | None Available | |
| Morequity Inc | $89,497 | None Available |
Source: Public Records
Mortgage History
| Date | Status | Borrower | Loan Amount |
|---|---|---|---|
| Previous Owner | Mathias Jennifer L | $48,800 |
Source: Public Records
Tax History
| Year | Tax Paid | Tax Assessment Tax Assessment Total Assessment is a certain percentage of the fair market value that is determined by local assessors to be the total taxable value of land and additions on the property. | Land | Improvement |
|---|---|---|---|---|
| 2025 | $3,088 | $421,070 | $96,250 | $324,820 |
| 2024 | $2,145 | $196,011 | $23,375 | $172,636 |
| 2023 | $2,012 | $196,011 | $23,375 | $172,636 |
| 2022 | $1,917 | $196,011 | $23,375 | $172,636 |
| 2021 | $1,656 | $196,011 | $23,375 | $172,636 |
| 2020 | $1,636 | $196,011 | $23,375 | $172,636 |
| 2019 | $1,636 | $196,011 | $23,375 | $172,636 |
| 2018 | $1,412 | $154,812 | $23,025 | $131,787 |
| 2017 | $1,397 | $154,812 | $23,025 | $131,787 |
| 2016 | $1,307 | $149,384 | $23,025 | $126,359 |
| 2015 | $1,264 | $120,799 | $25,717 | $95,082 |
| 2014 | $1,264 | $120,799 | $25,717 | $95,082 |
Source: Public Records
Map
Nearby Homes
- 2620 E Geer St
- 2807 Beck Rd
- 2548 Ferrell Rd
- 2711 Mortise Ct
- 2616 Bullock Rd
- 2902 Framer Ln
- 3019 Hammer Creek Rd
- 1204 Sawmill Grove Dr
- 1144 Sawmill Grove Dr
- 1142 Sawmill Grove Dr
- 1207 Sawmill Grove Dr
- 1138 Sawmill Grove Dr
- 3719 Mountain Brook Cir
- 3721 Mountain Brook Cir
- 1133 Sawmill Grove Dr
- 1215 Carpenter Falls Ave
- 1123 Sawmill Grove Dr
- 1007 Merlin St
- 1117 Sawmill Grove Dr
- 1011 Merlin St
- 2714 E Geer St
- 2639 Ferrell Rd
- 2716 E Geer St
- 2711 E Geer St
- 2703 Ferrell Rd
- 2718 E Geer St
- 2633 Ferrell Rd
- 2639 E Geer St
- 2722 E Geer St
- 2705 Ferrell Rd
- 2637 E Geer St
- 2634 E Geer St Unit 4A
- 2634 E Geer St
- 2709 Cliffside Dr
- 2631 Ferrell Rd
- 2632 Ferrell Rd
- 2631 E Geer St
- 2627 Ferrell Rd
- 2625 E Geer St
- 2706 Ferrell Rd
Your Personal Tour Guide
Ask me questions while you tour the home.