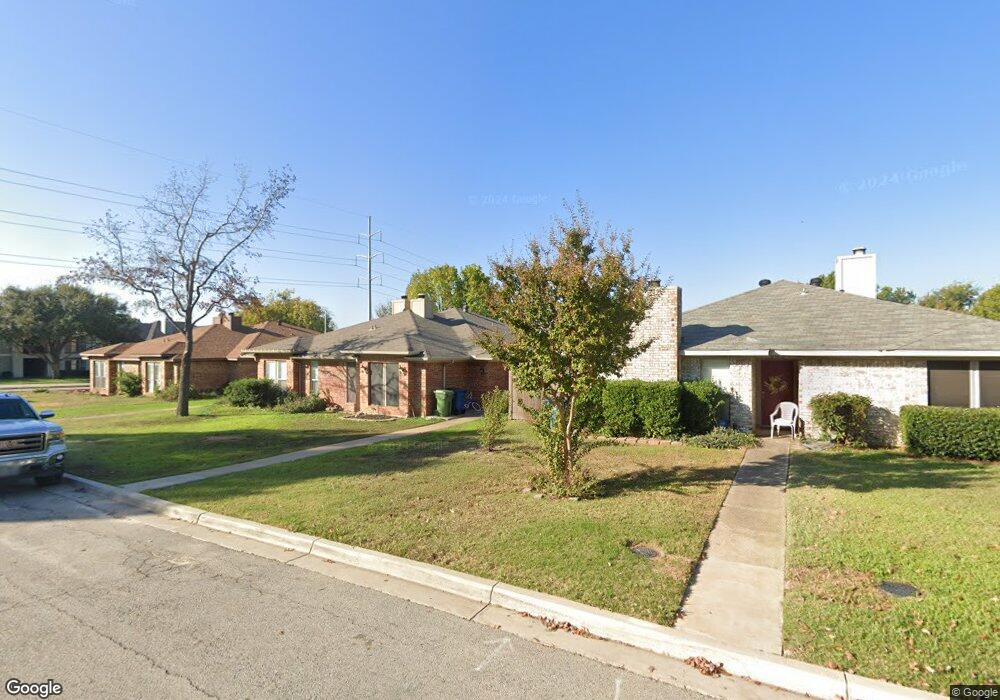
2710 N Odell Ct Grapevine, TX 76051
Estimated Value: $644,000 - $777,000
3
Beds
2
Baths
2,903
Sq Ft
$250/Sq Ft
Est. Value
About This Home
This home is located at 2710 N Odell Ct, Grapevine, TX 76051 and is currently estimated at $725,323, approximately $249 per square foot. 2710 N Odell Ct is a home located in Tarrant County with nearby schools including Heritage Elementary School, Cross Timbers Middle School, and Grapevine High School.
Ownership History
Date
Name
Owned For
Owner Type
Purchase Details
Closed on
Nov 11, 2019
Sold by
Scotch Lessa A and Scotch Family Trust
Bought by
Scotch Lessa A
Current Estimated Value
Home Financials for this Owner
Home Financials are based on the most recent Mortgage that was taken out on this home.
Original Mortgage
$300,000
Interest Rate
3.65%
Mortgage Type
New Conventional
Purchase Details
Closed on
Dec 15, 2017
Sold by
Scotch Louis J and Scotch Lissa A
Bought by
Scotch Louis J and Scotch Lessa A
Home Financials for this Owner
Home Financials are based on the most recent Mortgage that was taken out on this home.
Original Mortgage
$350,000
Interest Rate
3.9%
Mortgage Type
New Conventional
Purchase Details
Closed on
May 27, 2016
Sold by
Scotch Louis J and Scotch Lessa A
Bought by
Scotch Louis J and Scotch Lessa A
Purchase Details
Closed on
Sep 21, 2000
Sold by
Scotch Lessa A
Bought by
Scotch Louis J and Scotch Lessa A
Create a Home Valuation Report for This Property
The Home Valuation Report is an in-depth analysis detailing your home's value as well as a comparison with similar homes in the area
Home Values in the Area
Average Home Value in this Area
Purchase History
| Date | Buyer | Sale Price | Title Company |
|---|---|---|---|
| Scotch Lessa A | -- | Allegiance Title | |
| Scotch Louis J | -- | None Available | |
| Scotch Louis J | -- | None Available | |
| Scotch Louis J | -- | -- |
Source: Public Records
Mortgage History
| Date | Status | Borrower | Loan Amount |
|---|---|---|---|
| Closed | Scotch Lessa A | $300,000 | |
| Closed | Scotch Louis J | $350,000 |
Source: Public Records
Tax History Compared to Growth
Tax History
| Year | Tax Paid | Tax Assessment Tax Assessment Total Assessment is a certain percentage of the fair market value that is determined by local assessors to be the total taxable value of land and additions on the property. | Land | Improvement |
|---|---|---|---|---|
| 2025 | $2,240 | $665,839 | $268,510 | $397,329 |
| 2024 | $2,240 | $665,839 | $268,510 | $397,329 |
| 2023 | $8,383 | $668,979 | $268,510 | $400,469 |
| 2022 | $9,006 | $558,684 | $268,510 | $290,174 |
| 2021 | $8,985 | $413,252 | $187,020 | $226,232 |
| 2020 | $8,464 | $384,806 | $187,020 | $197,786 |
| 2019 | $8,427 | $469,914 | $187,020 | $282,894 |
| 2018 | $1,997 | $335,944 | $187,020 | $148,924 |
| 2017 | $7,063 | $353,304 | $187,020 | $166,284 |
| 2016 | $6,421 | $352,148 | $184,020 | $168,128 |
| 2015 | $5,424 | $252,400 | $81,250 | $171,150 |
| 2014 | $5,424 | $252,400 | $81,250 | $171,150 |
Source: Public Records
Map
Nearby Homes
- 2805 Pine View Dr
- 3826 Shady Meadow Dr
- 3801 Hillside Trail
- 3530 Quail Crest St
- 2849 Timber Hill Dr
- 2669 Flameleaf Dr
- 2704 Yorkshire Ct
- 3904 Wagon Wheel Dr
- 4105 Williams Ct
- 3107 Wintergreen Terrace
- 3223 Wintergreen Terrace
- 2126 Los Robles St
- 2831 Creekwood Ct
- 2841 West Ct
- 3602 Soft Wind Ct
- 3206 Wintergreen Terrace
- 3601 William D Tate Ave
- 3008 Creekview Dr
- 3110 Fox Run Dr
- 4157 Heartstone Dr
- 2702 N Odell Ct
- 3818 Shady Meadow Dr
- 2724 N Odell Ct
- 3820 Shady Meadow Dr
- 3814 Shady Meadow Dr
- 2711 N Odell Ct
- 2701 S Odell Ct
- 2719 N Odell Ct
- 2805 Highcrest Dr
- 3822 Shady Meadow Dr
- 2715 S Odell Ct
- 3812 Shady Meadow Dr
- 3834 Shady Meadow Dr
- 2806 Highcrest Dr
- 2803 Highcrest Dr
- 2740 N Odell Ct
- 2745 N Odell Ct
- 3824 Shady Meadow Dr
- 2727 N O Dell Ct
- 2902 Woodland Hills Dr