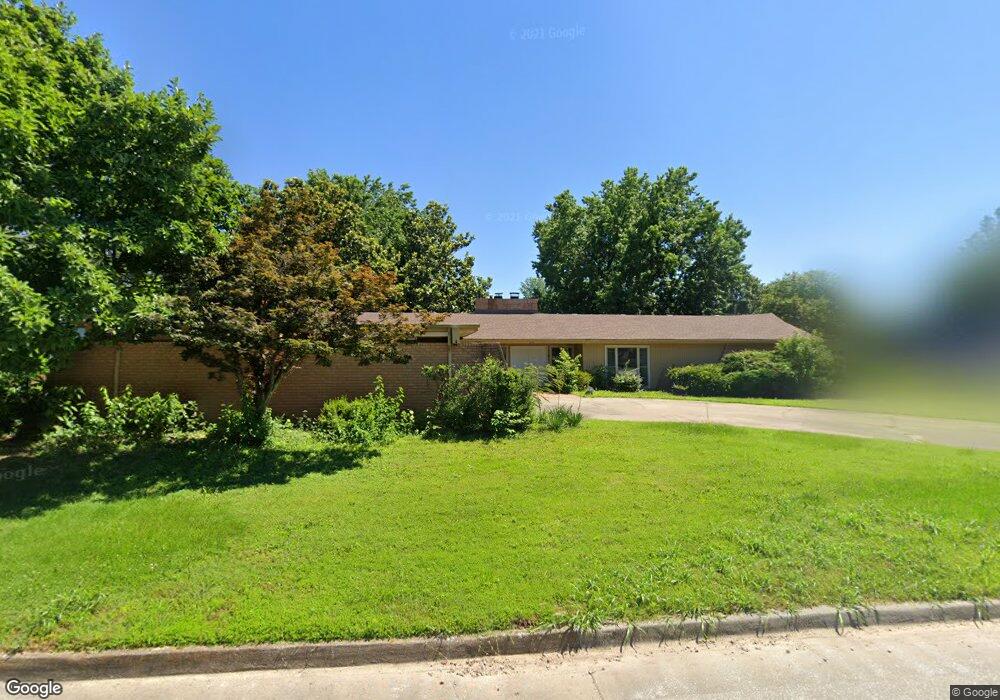
2710 Patti Ln Rogers, AR 72758
Estimated Value: $556,000 - $640,000
--
Bed
3
Baths
3,142
Sq Ft
$189/Sq Ft
Est. Value
About This Home
This home is located at 2710 Patti Ln, Rogers, AR 72758 and is currently estimated at $593,984, approximately $189 per square foot. 2710 Patti Ln is a home located in Benton County with nearby schools including Westside Elementary School, Oakdale Middle School, and Rogers Heritage High School.
Ownership History
Date
Name
Owned For
Owner Type
Purchase Details
Closed on
Jan 4, 2021
Sold by
C & T Design House Llc
Bought by
Johnston Robert Scott and Johnston Susan
Current Estimated Value
Purchase Details
Closed on
Feb 14, 2020
Sold by
Gulas Geannine B
Bought by
Midfirst Bank
Purchase Details
Closed on
Feb 12, 2020
Sold by
Gulas Geannine B and Gulas Michael W
Bought by
Midfirst Bank
Purchase Details
Closed on
Feb 11, 2020
Sold by
Gulas Geannine B
Bought by
Midfirst Bank
Purchase Details
Closed on
Sep 21, 2016
Sold by
Gulas Geannine and Gulas Geannine
Bought by
Gulas Michael and Gulas G
Purchase Details
Closed on
May 21, 2008
Sold by
Gaye Lucille Joann
Bought by
Gulas Michael W and Gulas Geannine B
Home Financials for this Owner
Home Financials are based on the most recent Mortgage that was taken out on this home.
Original Mortgage
$241,214
Interest Rate
6.07%
Mortgage Type
FHA
Purchase Details
Closed on
Feb 28, 1992
Bought by
Gaye Tr
Create a Home Valuation Report for This Property
The Home Valuation Report is an in-depth analysis detailing your home's value as well as a comparison with similar homes in the area
Home Values in the Area
Average Home Value in this Area
Purchase History
| Date | Buyer | Sale Price | Title Company |
|---|---|---|---|
| Johnston Robert Scott | $410,000 | None Available | |
| Midfirst Bank | $176,087 | None Listed On Document | |
| Midfirst Bank | $176,087 | None Available | |
| Midfirst Bank | $176,087 | None Listed On Document | |
| Gulas Michael | -- | -- | |
| Gulas Michael W | $245,000 | Rtc | |
| Gaye Tr | -- | -- |
Source: Public Records
Mortgage History
| Date | Status | Borrower | Loan Amount |
|---|---|---|---|
| Previous Owner | Gulas Michael W | $241,214 |
Source: Public Records
Tax History Compared to Growth
Tax History
| Year | Tax Paid | Tax Assessment Tax Assessment Total Assessment is a certain percentage of the fair market value that is determined by local assessors to be the total taxable value of land and additions on the property. | Land | Improvement |
|---|---|---|---|---|
| 2025 | $3,565 | $87,589 | $19,000 | $68,589 |
| 2024 | $2,819 | $53,294 | $19,000 | $34,294 |
| 2023 | $3,478 | $65,750 | $9,000 | $56,750 |
| 2022 | $3,241 | $65,750 | $9,000 | $56,750 |
| 2021 | $3,232 | $65,750 | $9,000 | $56,750 |
| 2020 | $2,771 | $50,480 | $4,600 | $45,880 |
| 2019 | $2,396 | $50,480 | $4,600 | $45,880 |
| 2018 | $2,410 | $50,480 | $4,600 | $45,880 |
| 2017 | $2,315 | $50,480 | $4,600 | $45,880 |
| 2016 | $2,034 | $50,480 | $4,600 | $45,880 |
| 2015 | $2,296 | $43,400 | $4,600 | $38,800 |
| 2014 | $1,946 | $43,400 | $4,600 | $38,800 |
Source: Public Records
Map
Nearby Homes
- 2309 & 2311 W Pecan St
- 2503 W Oak St
- 2512 W Beau Dr
- 0 N 23rd St
- 2308 W Willow St
- 2202 W Oak St
- 2601 W Oak St Unit 2
- 2732 Highland Cir
- 2104 W Oak St
- 1807 W Cypress St
- 2824 Highland Dr Unit 1
- 916 S 25th Place
- 904 S Dixson St Unit B
- 910 S 28th St
- 908 & 910 S 28th St
- 908 S 28th St Unit A & B
- 904 S Lafayette St
- 1717 W Poplar St
- 707 Turtle Creek Dr
- 2104 W Wood St