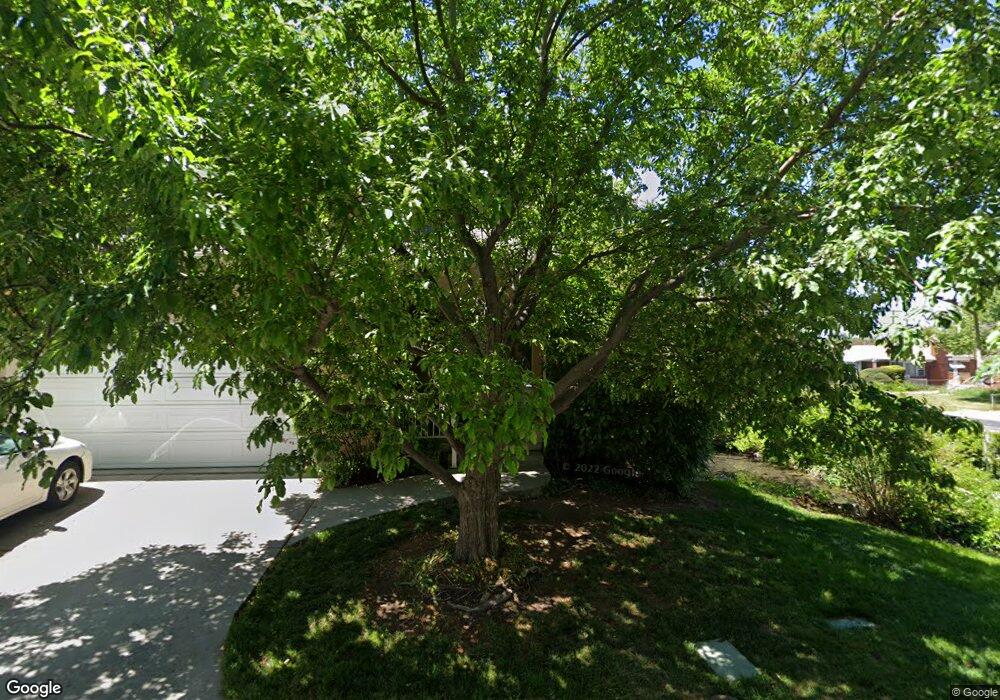
2710 S Forest Spring Way Salt Lake City, UT 84106
Sugar House NeighborhoodEstimated Value: $600,000 - $659,000
4
Beds
4
Baths
2,943
Sq Ft
$212/Sq Ft
Est. Value
About This Home
This home is located at 2710 S Forest Spring Way, Salt Lake City, UT 84106 and is currently estimated at $623,829, approximately $211 per square foot. 2710 S Forest Spring Way is a home located in Salt Lake County with nearby schools including Nibley Park School, Highland High School, and Carden Memorial School.
Ownership History
Date
Name
Owned For
Owner Type
Purchase Details
Closed on
Aug 20, 2025
Sold by
Speakman Charlotte M and Larcabal Charlotte Marie
Bought by
Norkin Oded and Norkin Rachel
Current Estimated Value
Purchase Details
Closed on
Feb 4, 2021
Sold by
Larcabal John
Bought by
Larcabal Charlotte Marie
Home Financials for this Owner
Home Financials are based on the most recent Mortgage that was taken out on this home.
Original Mortgage
$255,144
Interest Rate
2.6%
Mortgage Type
New Conventional
Purchase Details
Closed on
Jan 29, 2018
Sold by
Larcabal Charlotte Marie
Bought by
Larcabal Charlotte Marie and Larcabal John
Home Financials for this Owner
Home Financials are based on the most recent Mortgage that was taken out on this home.
Original Mortgage
$284,400
Interest Rate
3.93%
Mortgage Type
New Conventional
Purchase Details
Closed on
May 1, 2012
Sold by
Lucas Helen Lark Oswald
Bought by
Charlson Paul and Charlson Shannon
Home Financials for this Owner
Home Financials are based on the most recent Mortgage that was taken out on this home.
Original Mortgage
$265,500
Interest Rate
3.9%
Mortgage Type
New Conventional
Purchase Details
Closed on
Aug 15, 2005
Sold by
Smith Royce J and Lowery Smith Paula
Bought by
Lucas Helen Lark Oswald and Oswald Fred M
Home Financials for this Owner
Home Financials are based on the most recent Mortgage that was taken out on this home.
Original Mortgage
$295,900
Interest Rate
5.48%
Mortgage Type
Unknown
Purchase Details
Closed on
May 23, 2005
Sold by
Smith Royce J and Lowery-Smith Paula
Bought by
Smith Royce J and Lowery-Smith Paula
Purchase Details
Closed on
Oct 22, 2002
Sold by
Smith Royce James and Lowery Smith Paula
Bought by
Smith Royce James and Lowery Smith Paula
Home Financials for this Owner
Home Financials are based on the most recent Mortgage that was taken out on this home.
Original Mortgage
$200,000
Interest Rate
6.05%
Purchase Details
Closed on
Oct 16, 2002
Sold by
Smith Royce James
Bought by
Smith Royce James and Lowery Smith Paula
Home Financials for this Owner
Home Financials are based on the most recent Mortgage that was taken out on this home.
Original Mortgage
$200,000
Interest Rate
6.05%
Purchase Details
Closed on
Oct 26, 1998
Sold by
Iverson Dewayne E
Bought by
Smith Royce James
Home Financials for this Owner
Home Financials are based on the most recent Mortgage that was taken out on this home.
Original Mortgage
$204,250
Interest Rate
6.6%
Create a Home Valuation Report for This Property
The Home Valuation Report is an in-depth analysis detailing your home's value as well as a comparison with similar homes in the area
Home Values in the Area
Average Home Value in this Area
Purchase History
| Date | Buyer | Sale Price | Title Company |
|---|---|---|---|
| Norkin Oded | -- | Inwest Title Services | |
| Larcabal Charlotte Marie | -- | Cottonwood Title | |
| Larcabal Charlotte Marie | -- | Integrated Title Ins Svcs | |
| Larcabal Charlotte Marie | -- | Mountain View Title & Escorw | |
| Charlson Paul | -- | Sutherland Title | |
| Lucas Helen Lark Oswald | -- | Title West | |
| Smith Royce J | -- | None Available | |
| Smith Royce James | -- | First American Title | |
| Smith Royce James | -- | First American Title | |
| Smith Royce James | -- | -- |
Source: Public Records
Mortgage History
| Date | Status | Borrower | Loan Amount |
|---|---|---|---|
| Previous Owner | Larcabal Charlotte Marie | $255,144 | |
| Previous Owner | Larcabal Charlotte Marie | $284,400 | |
| Previous Owner | Charlson Paul | $265,500 | |
| Previous Owner | Lucas Helen Lark Oswald | $295,900 | |
| Previous Owner | Smith Royce James | $200,000 | |
| Previous Owner | Smith Royce James | $204,250 |
Source: Public Records
Tax History Compared to Growth
Tax History
| Year | Tax Paid | Tax Assessment Tax Assessment Total Assessment is a certain percentage of the fair market value that is determined by local assessors to be the total taxable value of land and additions on the property. | Land | Improvement |
|---|---|---|---|---|
| 2025 | $2,936 | $627,900 | $140,500 | $487,400 |
| 2024 | $2,936 | $560,200 | $136,200 | $424,000 |
| 2023 | $2,936 | $513,400 | $108,500 | $404,900 |
| 2022 | $3,003 | $518,200 | $106,300 | $411,900 |
| 2021 | $2,746 | $429,000 | $81,800 | $347,200 |
| 2020 | $2,645 | $393,300 | $72,600 | $320,700 |
| 2019 | $2,557 | $357,800 | $66,000 | $291,800 |
| 2018 | $3,034 | $413,300 | $66,000 | $347,300 |
| 2017 | $3,012 | $384,500 | $66,000 | $318,500 |
| 2016 | $2,866 | $347,400 | $66,000 | $281,400 |
| 2015 | $2,993 | $343,900 | $67,300 | $276,600 |
| 2014 | $2,590 | $295,200 | $73,300 | $221,900 |
Source: Public Records
Map
Nearby Homes
- 916 E Forest View Ave
- 829 E 2700 S
- 1978 S Windsor Cir
- 2728 S 800 E
- 2618 S 1100 E
- 2609 S Lake St
- 1150 E 2700 S Unit G51
- 1150 E 2700 S Unit 50G
- 1130 E 2700 S Unit K83
- 2725 S 700 E Unit H
- 2725 S 700 E Unit M
- 829 E Zenith Ave
- 2937 S 900 E
- 1152 E 2700 S Unit S148
- 2607 S 700 E
- 2922 S 800 E
- 2487 S 800 E
- 1192 E 2700 S
- 1190 E 2700 S Unit A4
- 1190 E 2700 S Unit A1
- 2712 Forest Spring Way
- 956 E 2700 S
- 2716 Forest Spring Way
- 2718 Forest Spring Way
- 2718 Forest Spring Way Unit 3
- 2718 S Forest Spring Way
- 938 E 2700 S
- 2720 Forest Spring Way
- 955 E 2700 S
- 947 E 2700 S
- 2728 Forest Spring Way
- 2728 S Forest Spring Way
- 934 E 2700 S
- 941 E 2700 S
- 935 E 2700 S
- 2730 Forest Spring Way
- 2730 S Forest Spring Way
- 926 E 2700 S
- 2722 S 1000 E Unit 4
- 2722 S 1000 E Unit 4B