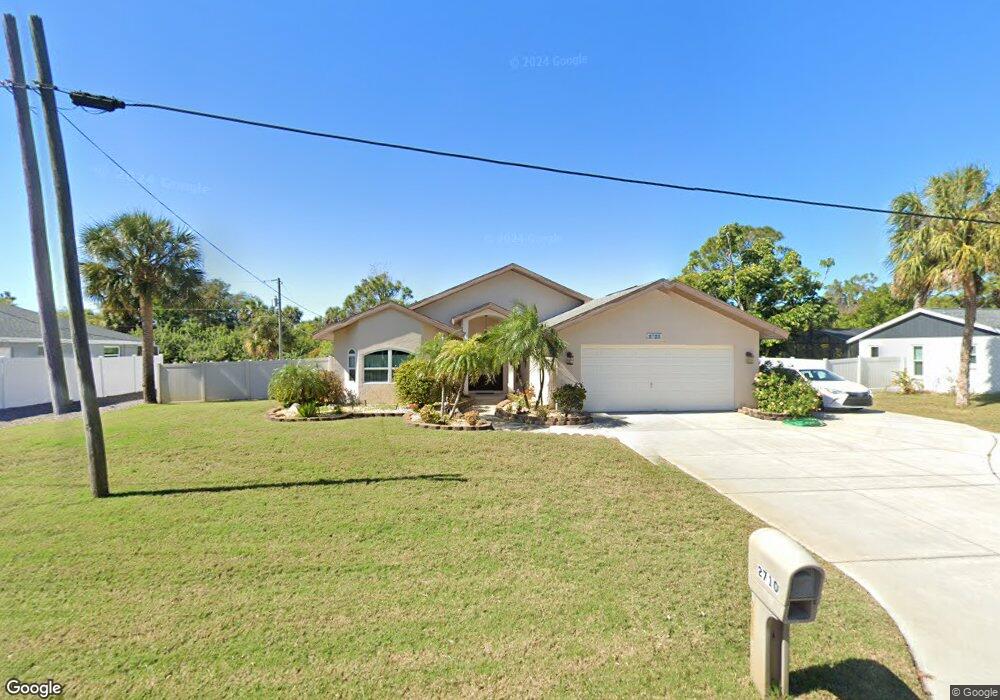
2710 Shamrock Dr Unit 46 Venice, FL 34293
South Venice NeighborhoodEstimated Value: $366,612 - $406,000
3
Beds
2
Baths
1,728
Sq Ft
$225/Sq Ft
Est. Value
About This Home
This home is located at 2710 Shamrock Dr Unit 46, Venice, FL 34293 and is currently estimated at $388,403, approximately $224 per square foot. 2710 Shamrock Dr Unit 46 is a home located in Sarasota County with nearby schools including Venice Elementary School, Venice Middle School, and Venice High School.
Ownership History
Date
Name
Owned For
Owner Type
Purchase Details
Closed on
Mar 22, 2019
Sold by
Roberts Debra
Bought by
Roberts Debra and Denra Roberts Trust
Current Estimated Value
Purchase Details
Closed on
Jan 1, 2017
Bought by
Roberts Debra
Purchase Details
Closed on
Jan 24, 2016
Sold by
Roberts Scott
Bought by
Roberts Debra
Purchase Details
Closed on
Mar 10, 2011
Sold by
Boisse Marcel E and Boisse Jacqueline R
Bought by
Roberts Scott and Roberts Debra
Purchase Details
Closed on
Jun 15, 2010
Sold by
Huwel Jack H and Mortimer Janet R
Bought by
Boisse Marcel E and Boisse Jacqueline R
Purchase Details
Closed on
Apr 30, 1997
Sold by
Sigmund Pamela J
Bought by
Huwel Jack H and Huwel Janet R
Home Financials for this Owner
Home Financials are based on the most recent Mortgage that was taken out on this home.
Original Mortgage
$81,200
Interest Rate
8.2%
Create a Home Valuation Report for This Property
The Home Valuation Report is an in-depth analysis detailing your home's value as well as a comparison with similar homes in the area
Home Values in the Area
Average Home Value in this Area
Purchase History
| Date | Buyer | Sale Price | Title Company |
|---|---|---|---|
| Roberts Debra | -- | Attorney | |
| Roberts Debra | $100 | -- | |
| Roberts Debra | -- | Attorney | |
| Roberts Scott | $155,000 | Alliance Group Title Llc | |
| Boisse Marcel E | $102,000 | Chelsea Title Company | |
| Huwel Jack H | $101,500 | -- |
Source: Public Records
Mortgage History
| Date | Status | Borrower | Loan Amount |
|---|---|---|---|
| Previous Owner | Huwel Jack H | $81,200 |
Source: Public Records
Tax History Compared to Growth
Tax History
| Year | Tax Paid | Tax Assessment Tax Assessment Total Assessment is a certain percentage of the fair market value that is determined by local assessors to be the total taxable value of land and additions on the property. | Land | Improvement |
|---|---|---|---|---|
| 2024 | $2,793 | $229,361 | -- | -- |
| 2023 | $2,793 | $222,681 | $0 | $0 |
| 2022 | $2,680 | $216,195 | $0 | $0 |
| 2021 | $2,681 | $209,898 | $0 | $0 |
| 2020 | $2,670 | $207,000 | $32,800 | $174,200 |
| 2019 | $2,434 | $191,600 | $40,000 | $151,600 |
| 2018 | $2,846 | $189,000 | $39,600 | $149,400 |
| 2017 | $2,821 | $182,952 | $0 | $0 |
| 2016 | $2,748 | $180,600 | $34,600 | $146,000 |
| 2015 | $2,495 | $151,200 | $15,900 | $135,300 |
| 2014 | $2,673 | $138,400 | $0 | $0 |
Source: Public Records
Map
Nearby Homes
- 2430 Shamrock Dr
- 3035 Shamrock Dr
- 508 N Quincy Rd
- 0 Aurora Rd Unit MFRU8236786
- 0 Avalon Rd Unit MFRA4636892
- 880 Queen Rd
- 530 Foxglove Rd
- 0 Queen Rd Unit MFRN6140983
- 201 Dragon Rd
- 3085 Arrowhead Rd
- 3339 Shamrock Dr
- 545 Bluebell Rd
- 185 Zephyr Rd
- 3363 Shamrock Dr
- 751 Nantucket Rd
- 1746 Tamiami Trail S
- 0 Dragon St Unit 225070561
- 0 Dragon St Unit 225070560
- 415 Terrapin Rd
- 0 Ginger St Unit MFRC7511849
- 2690 Shamrock Dr
- 2730 Shamrock Dr
- 2670 Shamrock Dr
- 2760 Shamrock Dr
- 2725 Shamrock Dr
- 2701 Shamrock Dr
- 2705 Shamrock Dr
- 2755 Shamrock Dr
- 721 Zephyr Rd
- 2780 Shamrock Dr
- 2641 Shamrock Dr
- 2630 Shamrock Dr
- 2740 Sunset Beach Dr
- 2787 Shamrock Dr
- 2750 Sunset Beach Dr
- 2730 Sunset Beach Dr
- 2800 Shamrock Dr
- 2770 Sunset Beach Dr
- 690 Sunset Beach Dr
- 680 Zephyr Rd