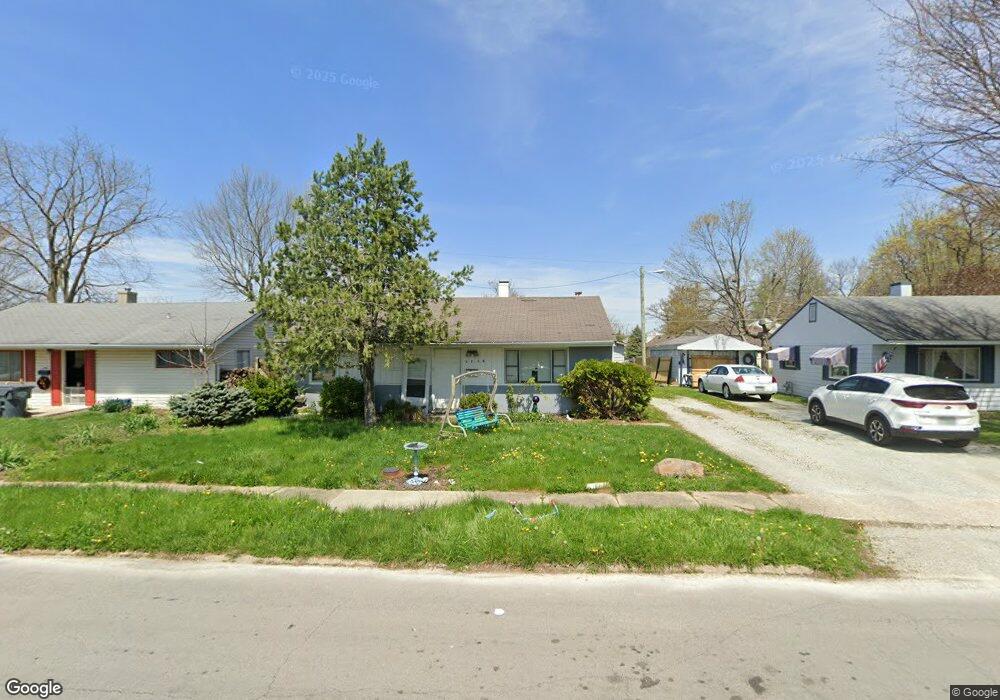
2710 W 18th St Anderson, IN 46011
Estimated Value: $112,000 - $139,000
3
Beds
1
Bath
1,020
Sq Ft
$119/Sq Ft
Est. Value
About This Home
This home is located at 2710 W 18th St, Anderson, IN 46011 and is currently estimated at $120,926, approximately $118 per square foot. 2710 W 18th St is a home located in Madison County with nearby schools including Anderson Elementary School, Highland Middle School, and Anderson High School.
Ownership History
Date
Name
Owned For
Owner Type
Purchase Details
Closed on
Jan 15, 2024
Sold by
2710 West 18Th Street Land Trust
Bought by
K & N Properties Llc
Current Estimated Value
Purchase Details
Closed on
Mar 21, 2019
Sold by
Nola 17 Llc
Bought by
2710 W 18Th St Land St
Purchase Details
Closed on
Feb 14, 2019
Sold by
Madison County Auditor
Bought by
Nola 17 Llc
Purchase Details
Closed on
Sep 1, 2011
Sold by
Real Eulalio Magallanes Del
Bought by
Mem Properties Llc
Purchase Details
Closed on
Jan 17, 2009
Sold by
Delreal Magallanes
Bought by
Hernandez Libraba
Purchase Details
Closed on
Dec 4, 2008
Sold by
Beasley Cynthia A and Boyd Cynthia A
Bought by
Us Bank Na
Purchase Details
Closed on
Oct 24, 2008
Sold by
Us Bank Na
Bought by
Del Real Eulalio Magallanes
Purchase Details
Closed on
Jun 6, 2008
Sold by
Boyd Lee Charles and Boyd Lisa M
Bought by
Us Bank Na
Create a Home Valuation Report for This Property
The Home Valuation Report is an in-depth analysis detailing your home's value as well as a comparison with similar homes in the area
Home Values in the Area
Average Home Value in this Area
Purchase History
| Date | Buyer | Sale Price | Title Company |
|---|---|---|---|
| K & N Properties Llc | -- | None Listed On Document | |
| 2710 W 18Th St Land St | -- | None Available | |
| Nola 17 Llc | $2,090 | None Available | |
| Mem Properties Llc | -- | None Available | |
| Hernandez Libraba | $39,900 | -- | |
| Us Bank Na | -- | -- | |
| Del Real Eulalio Magallanes | -- | -- | |
| Us Bank Na | $12,000 | -- |
Source: Public Records
Tax History Compared to Growth
Tax History
| Year | Tax Paid | Tax Assessment Tax Assessment Total Assessment is a certain percentage of the fair market value that is determined by local assessors to be the total taxable value of land and additions on the property. | Land | Improvement |
|---|---|---|---|---|
| 2024 | $1,060 | $47,700 | $5,400 | $42,300 |
| 2023 | $971 | $43,400 | $5,100 | $38,300 |
| 2022 | $975 | $43,600 | $4,900 | $38,700 |
| 2021 | $893 | $39,700 | $4,800 | $34,900 |
| 2020 | $856 | $37,900 | $4,500 | $33,400 |
| 2019 | $837 | $37,000 | $4,500 | $32,500 |
| 2018 | $787 | $34,100 | $4,500 | $29,600 |
| 2017 | $674 | $33,700 | $4,500 | $29,200 |
| 2016 | $1,837 | $35,100 | $4,500 | $30,600 |
| 2014 | $775 | $38,500 | $4,600 | $33,900 |
| 2013 | $775 | $38,500 | $4,600 | $33,900 |
Source: Public Records
Map
Nearby Homes
- 1827 Fulton St
- 2308 W 16th St
- 0 Fulton St Unit MBR22051501
- 1818 Dewey St
- 2104 W 16th St
- 1820 Euclid Dr
- 2205 Nichol Ave
- 2011 W 18th St
- 1411 Halford St
- 2006 Costello Dr
- 3008 Nichol Ave
- 2121 Euclid Dr
- 1616 Reverend J T Menifee St
- 2904 W 25th St
- 910 Raible Ave
- 1222 Irving Way
- 1830 Nichol Ave
- 2105 Arrow Ave
- 2015 Rosewood Dr
- 2401 W 27th St
- 2714 W 18th St
- 2706 W 18th St
- 1735 Lockerbie Ct
- 2702 W 18th St
- 2718 W 18th St
- 1736 Lockerbie Ct
- 2711 W 18th St
- 2707 W 18th St
- 2722 W 18th St
- 2622 W 18th St
- 1727 Lockerbie Ct
- 2715 W 18th St
- 2703 W 18th St
- 2719 W 18th St
- 2623 W 18th St
- 1730 Bennington Ct
- 2618 W 18th St
- 2726 W 18th St
- 1738 Bennington Ct
- 1728 Lockerbie Ct